


 FxWirePro- Major Crypto levels and bias summary
  FxWirePro- Major Crypto levels and bias summary
  FxWirePro- Major Crypto levels and bias summary


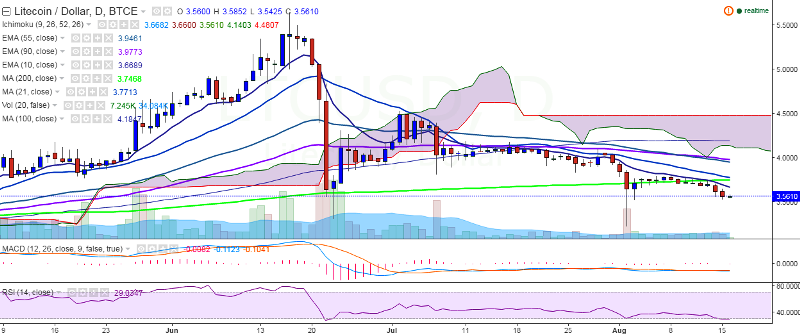
LTC/USD traded in a choppy range on Tuesday and currently trades at 3.55 levels at the time of writing (BTC-e).
Ichimoku analysis of 4-hour chart:
Tenkan Sen: 3.58
Kijun Sen: 3.63
Trend reversal: 3.74 (200-day MA)
The pair has weakened considerably after breaking below the major trend line 200-day MA. LTC/USD should close above this level to resume its upward trend. Beyond 3.74 levels (200-day MA), it faces major resistance at 3.98 levels (90-day EMA) and then at 4.18 (100-day MA).
On the flipside, support is seen at 3.44 (61.8% retracement of 3.22 and 3.80) and any weakness below this level would drag the pair to 3.22 (August 2 low)/3.00. Short-term trend is bearish for the pair.

- News

- Economy

- Central Banks
- Investing
- Research
- Roundups
- Digital Currency
- Insights
- Technical Analysis
- Technology
- Business
- Law
- Health
- Nature
- Fintech
- Science
- Topic
- Opinions
- ©Econometrics LLC . All Rights Reserved.
LTC/USD trades weak, targets 3.22
Tuesday, August 16, 2016 10:54 AM UTC
Editor's Picks


- Market Data
Most Popular


