


 Ethereum Cracks Under $1,700: Sell the Rally Near $1,750 as Bears Eye $1,380–$1,200
  FxWirePro- Major Crypto levels and bias summary
  BTC’s Bear Bounce: Sell the Rally Near $66K as Bears Target $59K–$52K Breakdown
  FxWirePro- Major Crypto levels and bias summary


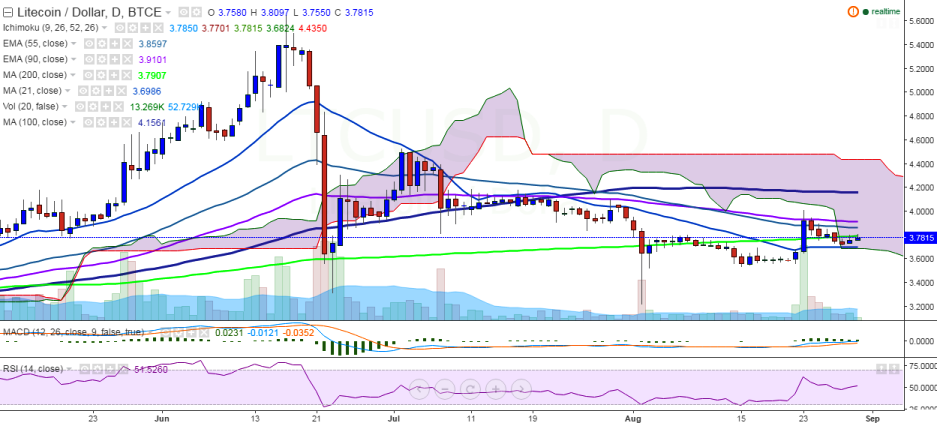
LTC/USD further moved upwards on Tuesday, continuing its rebound from 3.71 levels hit on August 28. It is currently trading at 3.78 levels at the time of writing (BTC-e).
Ichimoku analysis of daily chart:
Tenkan Sen: 3.78
Kijun Sen: 3.77
Trend reversal: 3.91 (90 EMA)
“LTC/USD briefly broke above 200-day MA and is looking for a close above this level, which would see a further jump in the pair”, FxWirePro said.
The pair is hovering around 3.78 levels (200-day MA) and a strong break above this level would take it to 3.91 (90 EMA)/4.15 (100-day MA).
On the other hand, support is seen at 3.69 (21-day MA) and a break below would target 3.50/3.22 (August 02 low).

- News

- Economy

- Central Banks
- Investing
- Research
- Roundups
- Digital Currency
- Insights
- Technical Analysis
- Technology
- Business
- Law
- Health
- Nature
- Fintech
- Science
- Topic
- Opinions
- ©Econometrics LLC . All Rights Reserved.
LTC/USD continues upward move, targets 4.00
Tuesday, August 30, 2016 11:27 AM UTC
Editor's Picks


- Market Data
Most Popular


