


 FxWirePro- Major Crypto levels and bias summary


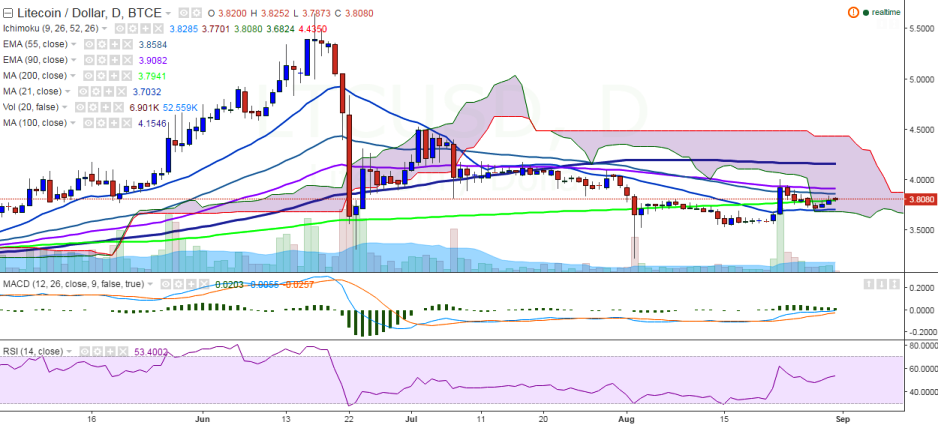
LTC/USD has broken above 200-day MA and struggling to find the momentum to sustain its move. It is currently trading at 3.80 levels at the time of writing (BTC-e).
Ichimoku analysis of daily chart:
Tenkan Sen: 3.78
Kijun Sen: 3.77
Trend reversal: 3.91 (90 EMA)
“The pair has taken support near 21-day MA and reverted from that level. It has broken above 200-day MA and struggling to sustain above this major trend line. LTC/USD should close above 200-day MA for further upward move”, FxWirePro said in a statement. “The pair has formed temporary top at 4.01 levels, so further bullishness could be seen only above this level”.
On the upside, the pair faces major resistance at 3.91 (90 EMA) and a break above would target 4.15 (100-day MA)/ 4.53 (July 02 high). On the reverse side, support is seen at 3.69 (21-day MA) and any weakness below this level would see it falling to 3.50/3.22 (August 02 low).

- News

- Economy

- Central Banks
- Investing
- Research
- Roundups
- Digital Currency
- Insights
- Technical Analysis
- Technology
- Business
- Law
- Health
- Nature
- Fintech
- Science
- Topic
- Opinions
- ©Econometrics LLC . All Rights Reserved.
LTC/USD breaks above 200-day MA, slight jump till 4.00 likely
Wednesday, August 31, 2016 11:52 AM UTC
Editor's Picks


- Market Data
Most Popular


