


 BTC’s Bear Bounce: Sell the Rally Near $66K as Bears Target $59K–$52K Breakdown
  FxWirePro- Major Crypto levels and bias summary


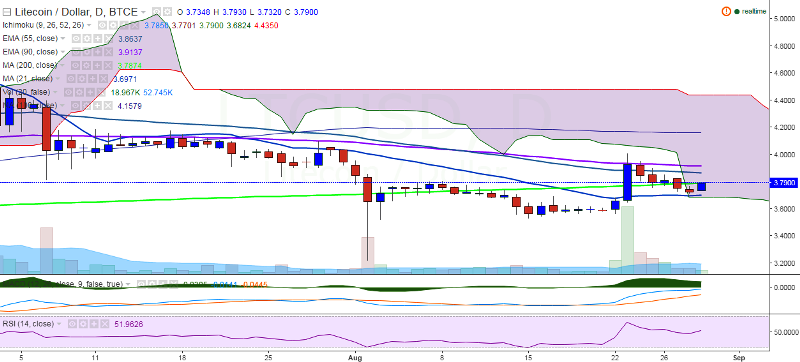
LTC/USD has taken support near 21-day MA and rebounded from that level. It is hovering around 200-day MA at 3.78 levels at the time of writing (BTC-e).
Ichimoku analysis of daily chart:
Tenkan Sen: 3.78
Kijun Sen: 3.76
Trend reversal: 3.91 (90 EMA)
The pair should close above 3.78 (200-day MA) for further upside. A consistent move upwards above this level would face resistance at 3.91 (90 EMA) and then 4.15 (100-day MA). On the other hand, support is likely to be found at 3.69 (21-day MA) and a break below would see the pair falling to 3.50 (psychological level) and then 3.22 (August 02 low).

- News

- Economy

- Central Banks
- Investing
- Research
- Roundups
- Digital Currency
- Insights
- Technical Analysis
- Technology
- Business
- Law
- Health
- Nature
- Fintech
- Science
- Topic
- Opinions
- ©Econometrics LLC . All Rights Reserved.
LTC/USD bounces back, further jump only above 200-day MA
Monday, August 29, 2016 12:57 PM UTC
Editor's Picks


- Market Data
Most Popular


