


 LA fires: Long-term exposure to wildfire smoke is poorly understood − and a growing risk
  Extreme heat, flooding, wildfires – Colorado’s formerly incarcerated people on the hazards they faced behind bars
  How ongoing deforestation is rooted in colonialism and its management practices
  How to create a thriving forest, not box-checking ‘tree cover’
  Lake beds are rich environmental records — studying them reveals much about a place’s history
  Rice feeds billions of people – but its role in fueling climate change is growing
  Fertile land for growing vegetables is at risk — but a scientific discovery could turn the tide
  Burkina Faso and Mali’s fabulous flora: new plant life record released
  Parasites are ecological dark matter – and they need protecting
  Swimming in the sweet spot: how marine animals save energy on long journeys
  Fungi are among the planet’s most important organisms — yet they continue to be overlooked in conservation strategies
  The UK is surprisingly short of water – but more reservoirs aren’t the answer
  What’s so special about Ukraine’s minerals? A geologist explains
  How is Antarctica melting, exactly? Crucial details are beginning to come into focus


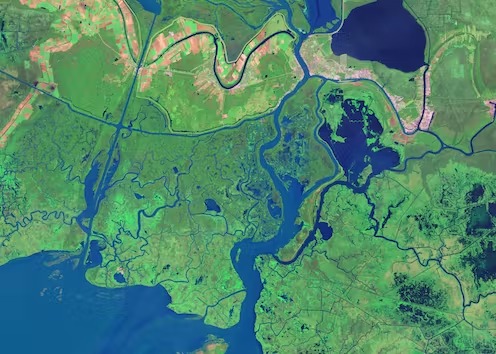

If you want to track changes in the Amazon rainforest, see the full expanse of a hurricane or figure out where people need help after a disaster, it’s much easier to do with the view from a satellite orbiting a few hundred miles above Earth.
Traditionally, access to satellite data has been limited to researchers and professionals with expertise in remote sensing and image processing. However, the increasing availability of open-access data from government satellites such as Landsat and Sentinel, and free cloud-computing resources such as Amazon Web Services, Google Earth Engine and Microsoft Planetary Computer, have made it possible for just about anyone to gain insight into environmental changes underway.
I work with geospatial big data as a professor. Here’s a quick tour of where you can find satellite images, plus some free, fairly simple tools that anyone can use to create time-lapse animations from satellite images.
For example, state and urban planners – or people considering a new home – can watch over time how rivers have moved, construction crept into wildland areas or a coastline eroded.
Landsat time-lapse animations show the river dynamics in Pucallpa, Peru. Qiusheng Wu, NASA Landsat
A Landsat time-lapse shows the shoreline retreat in the Parc Natural del Delta, Spain. Qiusheng Wu, NASA Landsat
Environmental groups can monitor deforestation, the effects of climate change on ecosystems, and how other human activities like irrigation are shrinking bodies of water like Central Asia’s Aral Sea. And disaster managers, aid groups, scientists and anyone interested can monitor natural disasters such as volcanic eruptions and wildfires.
GOES images show the decline of the crucial Colorado River reservoir Lake Mead since the 1980s and the growth of neighboring Las Vegas. Qiusheng Wu, NOAA GOES

A GOES satellite time-lapse shows the Hunga Tonga volcanic eruption on Jan. 15, 2022. Qiusheng Wu, NOAA GOES
Putting Landsat and Sentinel to work
There are over 8,000 satellites orbiting the Earth today. You can see a live map of them at keeptrack.space.
Some transmit and receive radio signals for communications. Others provide global positioning system (GPS) services for navigation. The ones we’re interested in are Earth observation satellites, which collect images of the Earth, day and night.
Landsat: The longest-running Earth satellite mission, Landsat, has been collecting imagery of the Earth since 1972. The latest satellite in the series, Landsat 9, was launched by NASA in September 2021.
In general, Landsat satellite data has a spatial resolution of about 100 feet (about 30 meters). If you think of pixels on a zoomed-in photo, each pixel would be 100 feet by 100 feet. Landsat has a temporal resolution of 16 days, meaning the same location on Earth is imaged approximately once every 16 days. With both Landsat 8 and 9 in orbit, we can get a global coverage of the Earth once every eight days. That makes comparisons easier.
Landsat data has been freely available to the public since 2008. During the Pakistan flood of 2022, scientists used Landsat data and free cloud-computing resources to determine the flood extent and estimated the total flooded area.

Landsat satellite images showing a side-by-side comparison of southern Pakistan in August 2021 (one year before the floods) and August 2022 (right) Qiusheng Wu, NASA Landsat
Sentinel: Sentinel Earth observation satellites were launched by the European Space Agency (ESA) as part of the Copernicus program. Sentinel-2 satellites have been collecting optical imagery of the Earth since 2015 at a spatial resolution of 10 meters (33 feet) and a temporal resolution of 10 days.
GOES: The images you’ll see most often in U.S. weather forecasting come from NOAA’s Geostationary Operational Environmental Satellites, or GOES. They orbit above the equator at the same speed Earth rotates, so they can provide continuous monitoring of Earth’s atmosphere and surface, giving detailed information on weather, climate, and other environmental conditions. GOES-16 and GOES-17 can image the Earth at a spatial resolution of about 1.2 miles (2 kilometers) and a temporal resolution of five to 10 minutes.
A GOES satellite shows an atmospheric river arriving on the West Coast in 2021. Qiusheng Wu, GOES
How to create your own visualizations
In the past, creating a Landsat time-lapse animation of a specific area required extensive data processing skills and several hours or even days of work. However, nowadays, free and user-friendly programs are available to enable anyone to create animations with just a few clicks in an internet browser.
For instance, I created an interactive web app for my students that anyone can use to generate time-lapse animations quickly. The user zooms in on the map to find an area of interest, then draws a rectangle around the area to save it as a GeoJSON file – a file that contains the geographic coordinates of the chosen region. Then the user uploads the GeoJSON file to the web app, chooses the satellite to view from and the dates and submits it. It takes the app about 60 seconds to then produce a time-lapse animation.
How to create satellite time-lapse animations.
There are several other useful tools for easily creating satellite animations. Others to try include Snazzy-EE-TS-GIF, an Earth Engine App for creating Landsat animations, and Planetary Computer Explorer, an explorer for searching and visualizing satellite imagery interactively.


