


 FxWirePro: USD/CAD falls after BoC rate hold and weak U.S. producer inflation
  FxWirePro- Woodies pivot (Major)
  FxWirePro :USD/JPY bulls loosen their grip a bit, dips to be bought
  FxWirePro: NZD/USD steadies around 0.5830,retains bid tone
  FxWirePro- Woodies pivot (Major)
  FxWirePro: NZD/USD trades in narrow range ,outlook bullish
  EUR/USD Holds Bullish Tone Despite Pullback from Yesterday’s High
  FxWirePro: AUD/USD edges lower, but bullish outlook persists
  AUDJPY Bullish Surge: Strong Australian Dollar Fuels Fresh Upside as Pair Holds Above 113.50 and All EMAs Align
  FxWirePro: GBP/NZD gains some upside momentum but still bearish
  FxWirePro: USD/JPY uptrend loses steam, remains on bullish path
  FxWirePro: EUR/AUD outlook weaker on renewed downside pressure
  FxWirePro: GBP/USD hits one-month high, scope for further upside
  ETH Stands Alone Bullish; BTC, SOL, XRP, BNB Neutral


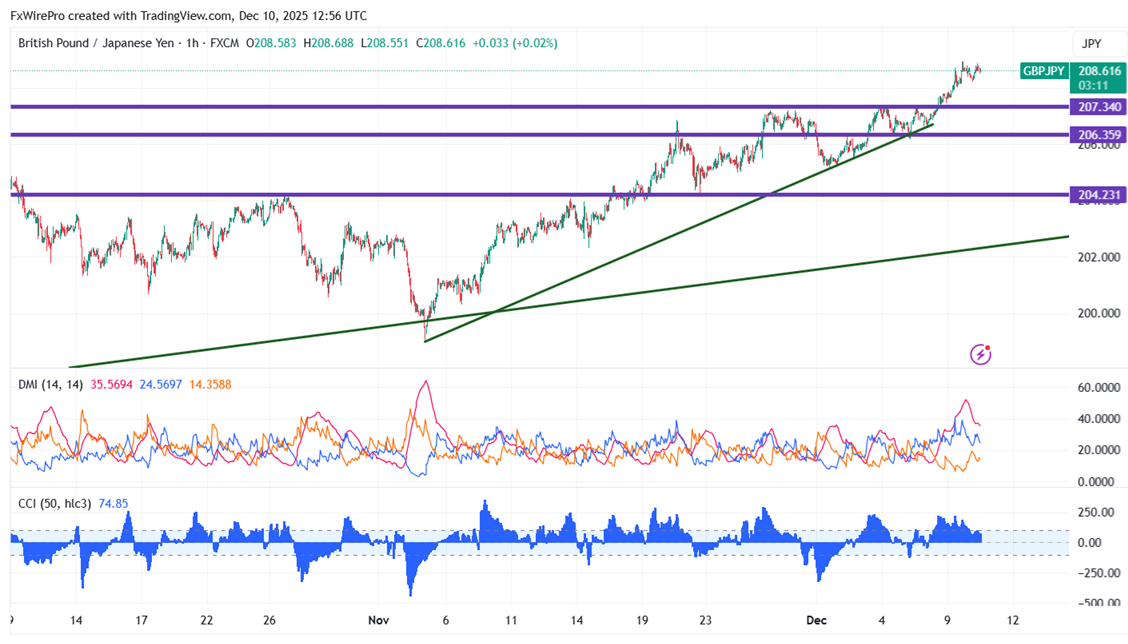
GBPJPY is trading in a narrow range after hitting a multi-year high. Intraday trend is bullish as long as support 207.40 holds. At the time of writing, it reached a high of 208.86 and is now trading at about 208.65.
Oscillators and moving averages to forecast the trend of GBPJPY
CMP- 208.534
EMA (one-hour chart)
55-EMA- 208.08
200-EMA- 206.29
365-EMA- 207.05. The pair trades above the short (55- EMA) and long-term moving average(365 EMA and below 200 EMA).
Major Support- 208.20. Any breach below will drag the pair down 207.40/207/206.47/205.40/205.
Major resistance - 209. Any break above confirms minor bullishness, a jump 210/210.58/212 is possible.
Indicator (4-hour chart)
CCI (50)- bullish
Average directional movement Index- Bullish. All indicators confirm a bullish trend.
It is good to buy on dips around 208 with SL around 207.40 for a TP of 210/210.58.


