


 FxWirePro- Major Crypto levels and bias summary
  FxWirePro: NZD/USD trades in narrow range ,outlook bullish
  FxWirePro- Woodies pivot (Major)
  GBPJPY Bullish Surge: Strong Pound Ignites Fresh Upside on Fed-BOE Policy Divergence as All EMAs Align
  FxWirePro :USD/JPY bulls loosen their grip a bit, dips to be bought
  FxWirePro- Major Pair levels and bias summary
  FxWirePro: GBP/NZD gains some upside momentum but still bearish
  Crypto Major Pair Action Bias: ETHUSD Bullish as BTCUSD, SOLUSD & XRPUSD Stay Neutral
  FxWirePro: AUD/USD edges lower, but bullish outlook persists
  Major Pair Action Bias: Extremely Bullish Surge Powers GBPUSD & NZDUSD as Bullish Momentum Ignites
  AUDJPY Bullish Surge: Strong Australian Dollar Fuels Fresh Upside as Pair Holds Above 113.50 and All EMAs Align
  FxWirePro: NZD/USD steadies around 0.5830,retains bid tone
  Gold Loses Steam After Strong U.S. Retail Sales
  GBPUSD, AUDUSD & NZDUSD Turn Extremely Bullish: Strong Positive Momentum Drives Major Pair Action Bias
  FxWirePro: GBP/USD hits one-month high, scope for further upside


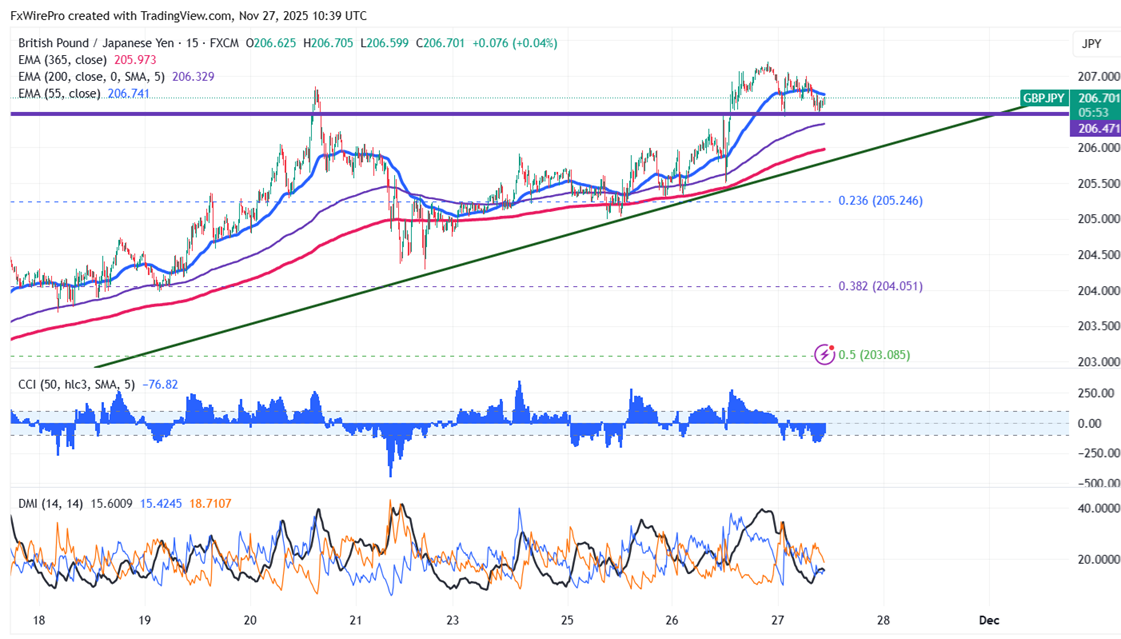
GBPJPY showed a minor decline after a massive buying. Intraday trend is neutral as long as resistance 207.25 holds. At the time of writing, it reaches a high of 206.492 and is now trading about 206.614.
Oscillators and moving averages to forecast the trend of GBPJPY
CMP- 206.67
EMA (4-hour chart)
55-EMA- 206.74
200-EMA- 206.32
365-EMA- 205.96. The pair trades below short (55- EMA) and long term moving average(365 EMA and 200 EMA).
Major Support- 206.40. Any breach below will drag the pair down 205.95/205.30/204.40/203.70/203.
Major resistance - 207.25. Any break above confirms minor bullishness, a jump 208/209.20/210 is possible.
Indicator (15-min chart)
CCI (50)- bearish
Average directional movement Index- Neutral. All indicators confirm a mixed trend.
It is good to sell below 206.40 with SL around 207.25 for a TP of 204.30.


