


 Major Pair Action Bias: Extremely Bullish Surge Powers GBPUSD & NZDUSD as Bullish Momentum Ignites
  NZDJPY Bullish Surge: Strong Kiwi Ignites Fresh Upside as 94 Support Holds and All EMAs Align
  ETH Stands Alone Bullish; BTC, SOL, XRP, BNB Neutral
  FxWirePro: EUR/AUD outlook weaker on renewed downside pressure
  FxWirePro:EUR/NZD dips below lower range, bearish bias increases
  FxWirePro- Woodies pivot (Major)
  FxWirePro: AUD/USD edges lower, but bullish outlook persists
  Crypto Major Pair Action Bias: ETHUSD Bullish as BTCUSD, SOLUSD & XRPUSD Stay Neutral
  FxWirePro: GBP/USD under pressure despite UK's modest economic growth
  FxWirePro- Major Pair levels and bias summary
  FxWirePro- Woodies pivot (Major)
  FxWirePro: EUR/AUD neutral in the near term, scope for downward resumption
  FxWirePro: NZD/USD trades in narrow range ,outlook bullish
  FxWirePro: GBP/USD hits one-month high, scope for further upside


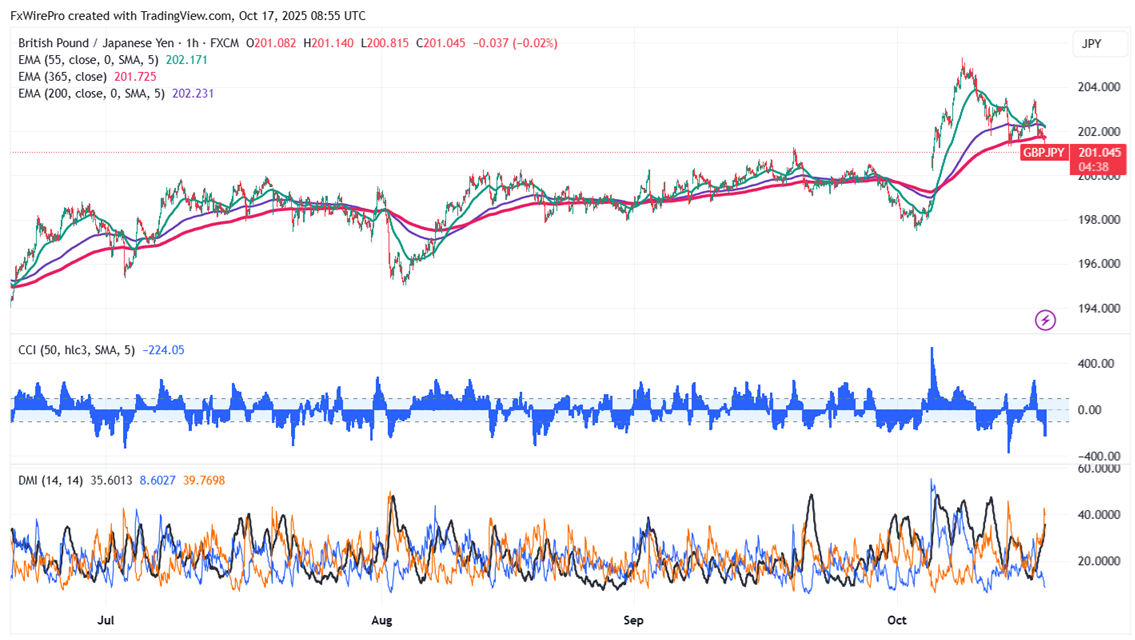
GBPJPY pared most of its gains on the strong yen. The intraday trend remains bearish as long as the resistance level of 202 holds. Trading around 201 right now, the pair reached an intraday high of 201.03.
Oscillators and moving averages to forecast the trend of GBPJPY
CMP- 201.02
EMA (1-hour chart)
55-EMA- 202.22
200-EMA- 202.24
365-EMA- 201.72. The pair trades above the short and the long-term moving average.
Major Support- 200.50. Any breach below will drag the pair down to 200/199.30/198.34/197.40.
Major resistance - 201.78. Any break above confirms minor bullishness, a jump to 202.45/203/203.55/204.20/205/205.35/206 is possible.
Indicator (1 hour chart)
CCI (50)- Bearish
Average directional movement Index- Bearish. All indicators confirm a bearish trend.
It is good to sell on rallies around 201.78-80 with SL around 203 for TP of 198.35/198.


