


 FxWirePro- Major Pair levels and bias summary
  FxWirePro- Woodies pivot (Major)
  JPY Action Bias: Extremely Bullish Surge Ignites Across NZD, GBP & AUD
  FxWirePro- Major Crypto levels and bias summary
  FxWirePro: USD/CAD falls after BoC rate hold and weak U.S. producer inflation
  FxWirePro: GBP/USD hits one-month high, scope for further upside
  Gold Loses Steam After Strong U.S. Retail Sales
  Major Pair Action Bias: Extremely Bullish Surge Powers GBPUSD & NZDUSD as Bullish Momentum Ignites
  FxWirePro: GBP/USD under pressure despite UK's modest economic growth
  FxWirePro- Major Pair levels and bias summary
  GBPUSD, AUDUSD & NZDUSD Turn Extremely Bullish: Strong Positive Momentum Drives Major Pair Action Bias
  FxWirePro: USD/ZAR advances as South African rand weakens amid renewed Middle East tensions
  AUDJPY Bullish Surge: Strong Australian Dollar Fuels Fresh Upside as Pair Holds Above 113.50 and All EMAs Align


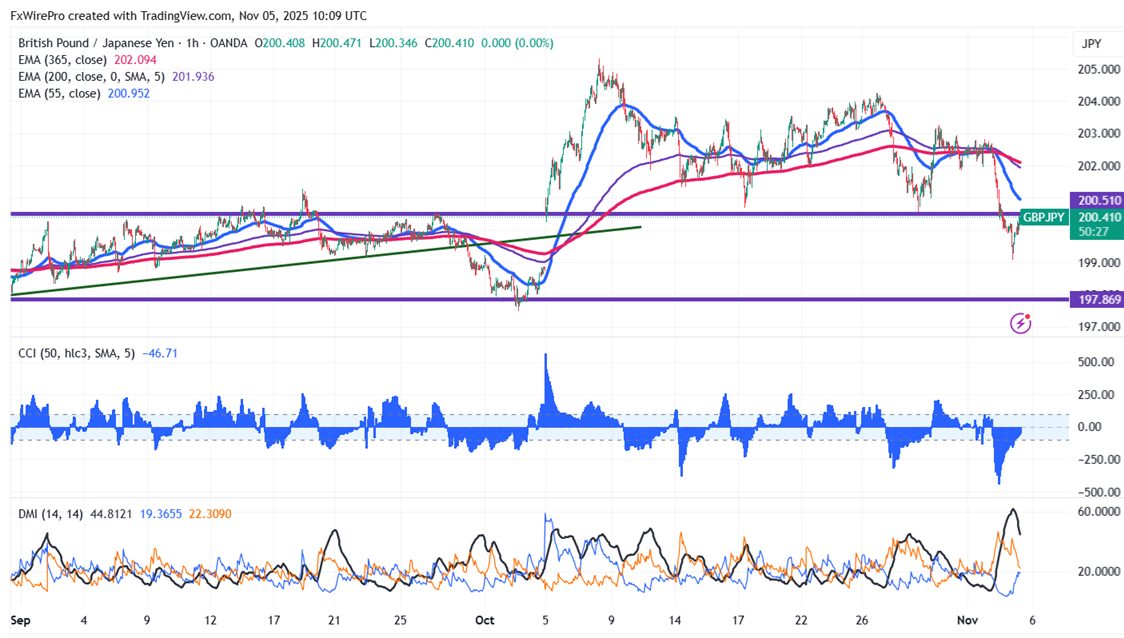
GBPJPY gained more than 100 pips after forming a minor bottom around 199.07. Intraday trend is bearish as long as the resistance at 201 holds. It hits an intraday high of 200.47 and is currently trading around 200.39..
Oscillators and moving averages to forecast the trend of GBPJPY
CMP- 200.394
EMA (1-hour chart)
55-EMA- 200.97
200-EMA- 201.95
365-EMA- 202.10. The pair trades below the short and above long long-term moving average.
Major Support- 200. Any breach below will drag the pair down to 199.30/199/198.34/197.40.
Major resistance - 201. Any break above confirms minor bullishness, a jump 202/202.80/203.30/204/204.25/205 is possible.
Indicator (1-hour chart)
CCI (50)- Bearish
Average directional movement Index- Neutral. All indicators confirm a bearish trend.
It is good to sell on rallies around 200.88-90 with SL around 202 for a TP of 199.


