


 Goldman AM Sees Strong Buyout Opportunities in Japan, South Korea and Australia
  Trump has made more than $1 billion from crypto in a year. How?
  Goldman Sachs Says China Competition Weighs More on EU Growth Than Trade Deficit
  JPMorgan Cuts Gold Price Forecast, Sees Bullion Reaching $4,500 by End of 2026
  Gold Pulls Back After Hitting $4,180 as Geopolitical Risk Sends Crude Higher
  Alcohol is one of the most dangerous drugs, yet its presence is ubiquitous in social settings and celebrations
  Vietnam’s population hit the 100 million milestone. Where’s it headed?
  In a rebuke to Trump, the Supreme Court rules that birthright citizenship is the law of the land


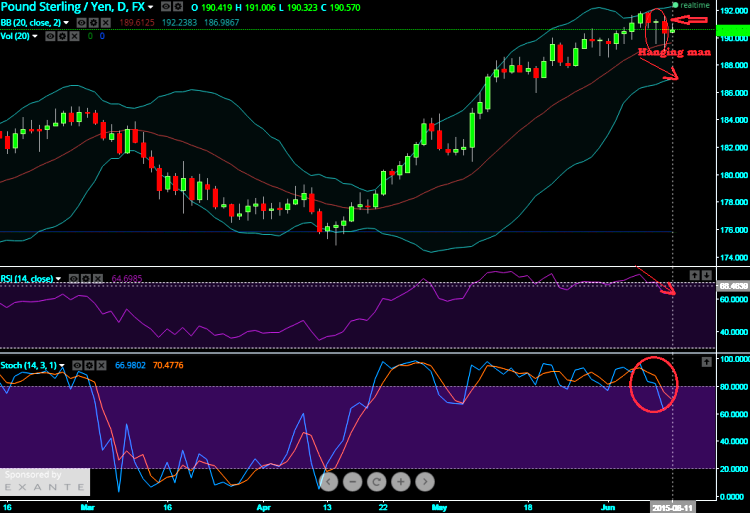
On daily chart 'Hanging-man candlestick' pattern on GBP/JPY's uptrend rally indicates weakness in this pair to sustain this trend.
In addition to this bearish candle pattern, oscillating indicators suggest overbought pressure on this pair.
14 day RSI gives a hint of downward price convergence with the bearish strength.
RSI (14) currently trending around 60.4558.
While Slow stochastic also signals overbought scene as a clear %D line crossover seen exactly above 80 levels.
%D line = 86.6221 & %K line = 73.4598
On weekly chart also early signs of overbought pressure are spotted out through momentum indicators.
Currency Derivatives Trade Ideas:
As a result of above technical observation we look ahead for more price depreciation in this pair.
Intraday traders can get benefitted from probable price falls in coming days by leveraging advantage through fresh short build ups on near month GBPJPY futures contracts.
On an intraday basis, we would also like to recommend slightly above At-The-Money binary puts of GBP/JPY are suggested for long positions.

- News

- Economy

- Central Banks
- Investing
- Research
- Roundups
- Digital Currency
- Insights
- Technical Analysis
- Technology
- Business
- Law
- Health
- Nature
- Fintech
- Science
- Topic
- Opinions
- ©Econometrics LLC . All Rights Reserved.
GBP/JPY’s downtrend is likely followed by hanging-man formation
Thursday, June 11, 2015 6:57 AM UTC
Editor's Picks



- Market Data
Most Popular




