


 Bank of England Expected to Hold Interest Rates at 3.75% as Inflation Remains Elevated
  Trump’s "Shock and Awe" Agenda: Executive Orders from Day One
  BOJ Rate Decision in Focus as Yen Weakness and Inflation Shape Market Outlook
  Oil Prices Dip Slightly Amid Focus on Russian Sanctions and U.S. Inflation Data
  Fed Governor Lisa Cook Warns Inflation Risks Remain as Rates Stay Steady
  BOJ Holds Interest Rates Steady, Upgrades Growth and Inflation Outlook for Japan
  South Africa Eyes ECB Repo Lines as Inflation Eases and Rate Cuts Loom
  European Stocks Rally on Chinese Growth and Mining Merger Speculation


EM central banks, namely BSP and BI, are predicted to shadow FOMC’s imminent hike, although the main reasons for their expected actions are currently divergent, with the former mostly addressing soaring inflation, while the latter is racing against time to stem ongoing currency depreciation and capital outflows.
Across the equity space, investors saw $14.4bn worth of inflows to the DM market, as compared to outflows of $4.3bn in the previous session. Notably, North America posted its strongest inflow in 27 sessions. In comparison to North America, DM-Asia and DM-Europe registered relatively minute flows at $285.7mn and -$802.2mn, respectively. In contrast, the EM equity space ended the week in red (-$508.3mn), reflecting sustained investor risk-off sentiment in the emerging markets. All members were in the negative range, with EM-Europe (-$178.1mn) posting the strongest outflow in the region.
EM bond funds gained $323.5mn, while the DM bond market registered inflows of $427.1mn. Across the DM space, the bond inflows were largely due to North America (+$1.9bn), while DM-Europe posted outflows of $1.3bn. In the EM bond space, all members ended the week in the positive range, as compared to a sea of red last session, albeit a relatively weak recovery in comparison to outflows in the 2 previous sessions.
An element of trade war fatigue appears to have settled on FX markets, judging from the sanguine reaction of EM/ high-beta currencies to the escalation in trade conflict when tariffs on $200bn of Chinese goods were announced earlier this week. If anything, the sharp turn higher in commodity sensitive assets (base metals, antipodean FX, Australian mining and Chinese infrastructure equities etc.) seem to suggest a concerted pricing in of a Chinese fiscal lift in response to the escalation.
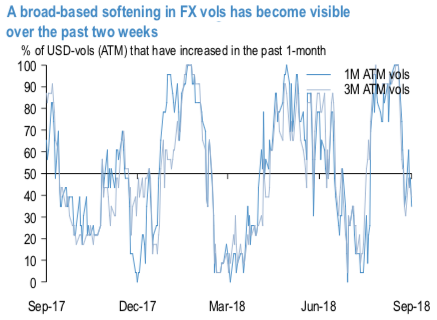
The USD TWI is now 1% off its MTD highs, and the effect of this risk positive impulse is being felt in the options market in the form of a broad-based softening of vols from their YTD highs (refer 1st chart). Much of this compression is stemming from a narrowing of EM vols from their multi-year wides relative to G7 vol: VXY EM has come in in excess of 1 %pt. from its peak, and EM currencies have been the biggest losers in vol over the past 2-weeks.
This process still looks early stage to us simply given the amount of retracement room that still exists for EM vol to re-visit pre-Q2 lows. Additionally, we find that simultaneous satisfaction of two simple technical requirements – the level of implied vol exceeding 2-sigma over rolling 3y averages, and the 2-week change in trailing 1m realized vol being negative – has done a reasonable of job identifying local tops in VXY EM in the past (refer 2nd chart).
While this rule has not been able to identify every single peak in the sample (the Greek eruption in 2010 was a notable miss for instance), crucially there have been no false positives; this composite indicator flagged a tactical top in this cycle early last week. We think that the current sell signal is more than just a statistical time series quirk, as it is robust to alternative specifications of z- score windows, sigma thresholds and realized vol lookbacks that have comparable track records of identifying past vol highs.
More importantly, the magnitude of correction from these peaks is substantial – median 2.2 % pts. over the three months following the signal – that makes participation in such moves worthwhile. Courtesy: JPM
Currency Strength Index: FxWirePro's hourly EUR is inching at 10 (which is neutral), USD spot index is flashing at 53 levels (which is bullish), while articulating (at 13:40 GMT).
For more details on the index, please refer below weblink: http://www.fxwirepro.com/currencyindex


