


 Goldman Sachs Says China Competition Weighs More on EU Growth Than Trade Deficit
  Elon Musk is remaking the world, like Henry Ford before him – but more dangerously
  AI can be a personal trainer in your pocket – but is it safe?
  Bernstein Names IAG, Ryanair as Top European Airline Stocks Ahead of Earnings
  Gold Pulls Back After Hitting $4,180 as Geopolitical Risk Sends Crude Higher
  Bank of America Upgrades T-Mobile to Buy, Says LEO Satellite Fears Are Overdone
  Trump has made more than $1 billion from crypto in a year. How?


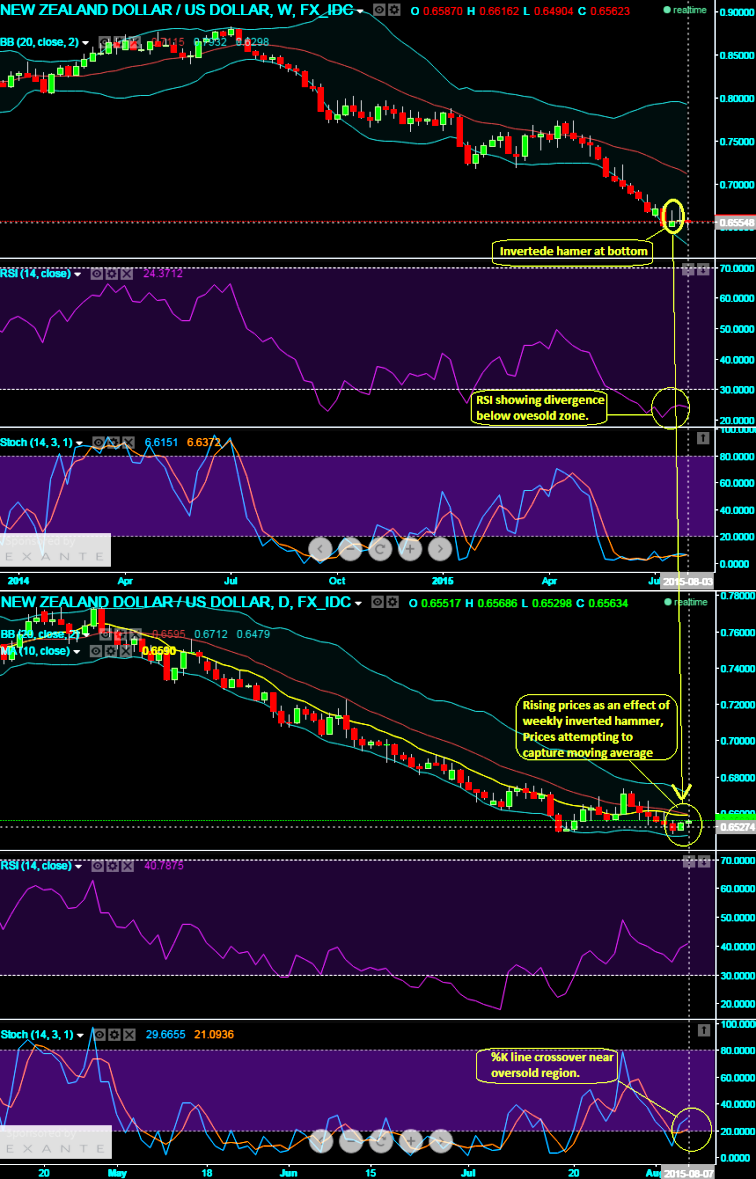
Technical glimpse:
The inverted hammer that was spotted out in our earlier call has factored in the daily prices (see what has happened on daily chart after the formation inverted hammer). The pair was able to hold 6 years lows of NZD/USD as inverted hammer pattern candle that was occurred on weekly chart exactly at 0.6572.
- RSI justifies rising prices: The pair at this psychological juncture testing supports as 14 weeks RSI shows positive convergence with spiking prices as it crossed below 30 levels which is oversold zone.
- Stochastic supports momentum: To substantiate this view on weekly charts slow stochastic curves were attempting to remain in sync with standpoint offered by RSI. Currently, RSI (14) is trending at 24.4127 and %K line crossover below 20 signifies a certain short term price recoveries if not long term bull sentiments.
- 10DMA: As we all know moving average is a lagging indicator, the moving average of ten day time frame was also suggesting the prevailing daily prices are attempting to follow uptrend that has created during last few intraday rallies.
- Trading tips: We look ahead for some minor dips in order for snatching the ideal entry points for the target at 0.6575 levels. The trade idea would be good to buy ATM binary calls at every dips for targets of 15-20 pips.







