


 Goldman Sachs Flags 3 Key Risks Ahead of Europe’s Earnings Season
  Alcohol is one of the most dangerous drugs, yet its presence is ubiquitous in social settings and celebrations
  Citi Raises TSMC Price Target as AI Chip Demand Strengthens Growth Outlook
  Michael Burry Shorts Tesla at $416 as AI and Semiconductor Bearish Bets Expand
  Vietnam’s population hit the 100 million milestone. Where’s it headed?
  Trump has made more than $1 billion from crypto in a year. How?
  JPMorgan Cuts Gold Price Forecast, Sees Bullion Reaching $4,500 by End of 2026
  Morgan Stanley Names BAE Systems Top European Defence Stock Despite Lower Price Target
  Smartphones are helping filmmakers tell the stories the movie industry overlooks


Demand for the crude oil is increasing healthy and increasing seasonally while crude production continues to decline.
Saudi Arabia’s Deputy Crown Prince Mohammed Bin Salman (MBS) said that Saudi Arabia could increase crude output to 11.5 Mb/d immediately and go to 12.5 Mb/d in 6-9 months "if we wanted to".
This has caused questions and concerns over whether the Saudis intend to flood the market with crude. While the Saudis have the capability to do this, based on a careful reading of MBS’s full comments in the story, we do not believe that is their intention.
That said, the upcoming typical seasonal increase in Saudi crude production may well keep these questions and concerns alive until after the summer is over.
Demand/Supply equation:
Demand - Ripping strong product demand is supporting margins and bolstering high crude runs. 4W average product demand was very robust, increasing by 770 kb/d to 20.0 Mb/d (+4.0% YoY). Margins are strong and runs are expected to climb seasonally.
Supply on weekly basis - US crude supply fell by 15 kb/d, entirely due to a drop in lower 48 production.
4W average US crude output is down by 413 kb/d (-4.4% YoY), while 4W average US crude imports are up by 89 kb/d (+1.2% YoY). US crude exports are actually down by 142 kb/d to 352 kb/d (-28.8% YoY).
Oil prices jumped on Monday as a huge wildfire in Canada's oil sand region knocked out over a million barrels in daily production capacity, contributing to a significant tightening of markets.
As a result, WTI futures jumped 93 cents or 2.08% to $45.59 per barrel by 09:05 GMT.
Crude for June delivery on the NYME tacked on 28 cents from previous flashes, to trade at $46.49a barrel by 13:22UTC, after rising by as much as 2.1% to a daily peak of $45.94.
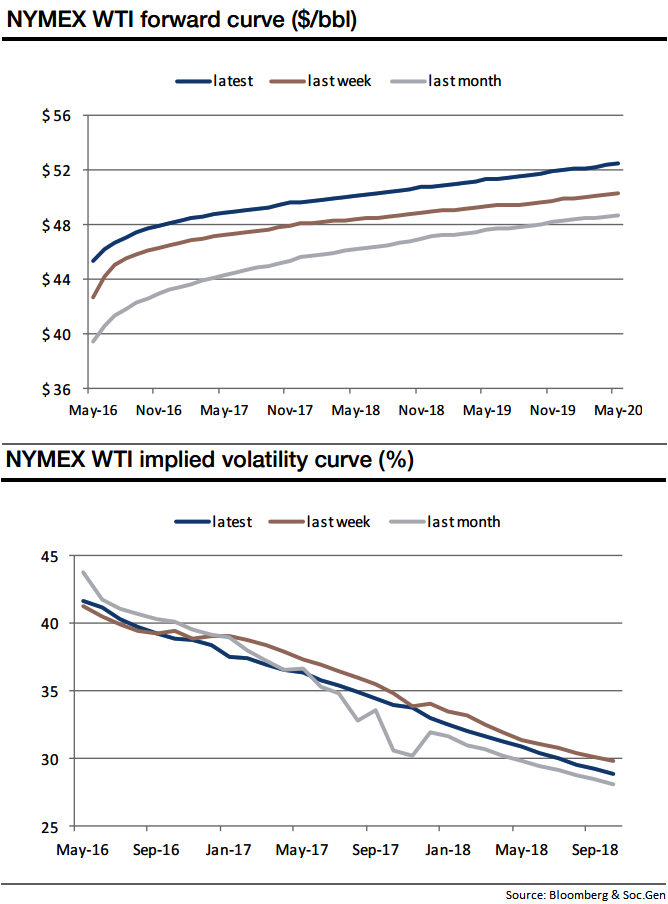
You can also observe NYMEX WTI forward rates are spiking higher above $45 a barrel, while implied volatilities are shrinking below 40% for May 2017, lower or reduced IV implies the market thinks the price will not move much.
You can trade the IV value by monitoring an IV chart for a specific underlying market for a certain time period and determine the IV range.
The peaks suggest the option is expensive to buy and the troughs suggest the option is inexpensive.
The IV information in charts can be utilized when deciding which options to buy or sell. It is significant to note you cannot match up to the IV values of different options.







