


 FxWirePro: USD/CNY slips as strong China exports data Lift yuan
  FxWirePro : EUR/NZD slips lower after soft US jobs report
  FxWirePro : EUR/NZD holding below 38.2% fibo ahead of US data
  EURGBP Bears Break Trendline: Sell Rallies at 0.8578 as Support Breach Eyes 0.8450 Slide
  NZDJPY Bears Lie in Wait: Sell Rallies at 93 for 90 Target with 94 Stop
  FxWirePro: AUD/USD eases as investors await U.S. employment figures
  FxWirePro- Major Crypto levels and bias summary
  AUDJPY Bears Poised: Sell Rallies at 111.55 for 108 Target with 112.20 Stop
  FxWirePro: GBP/AUD under pressure after disappointing U.S. employment data
  FxWirePro: NZD/USD retreats as Middle East instability weighs
  FxWirePro- Woodies pivot (Major)
  FxWirePro : USD/CAD falls as strong Canadian jobs data lifts loonie
  FxWirePro- Woodies pivot (Major)
  FxWirePro- Major Crypto levels and bias summary


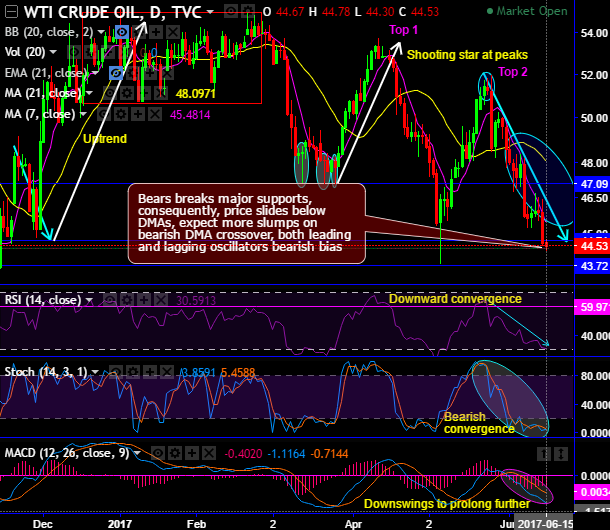
On daily charts of this energy commodity prices, bears break the major supports at 47.09 and currently at 44.71 levels, consequently, the current price slides well below DMAs, expect more slumps on bearish DMA crossover, both leading and lagging oscillators bearish bias.
The double top formation is traced out with top 1 at 53.74 levels and top 2 at 51.97 levels.
At top 2, the shooting star occurred at 51.27 levels, subsequently, the price slid steeply, for now, we expect more slumps on bearish DMA crossover.
While both leading and lagging oscillators have been bearish bias (refer daily charts).
RSI on this timeframe clearly indicates the strength in stern bearish trend, while same has been the case on stochastic curves, this leading oscillator has been halting in the oversold zone from the last couple of days but still bearish bias.
While on a broader perspective, the major trend which was in consolidation phase now resumed bearish sentiments, the consolidation phase in the major downtrend now seems to be totally exhausted as the bears have managed to breach below the baseline of ascending triangle that is likely to cause more weakness in upcoming months (refer monthly chart).
Both leading & lagging oscillators on this timeframe indicate the price slumps (see the rectangular area on monthly charts).
Both RSI and Stochastic curves have been indicating clear downward convergence right from overbought zones, you could observe intensified bearish momentum as there is %D crossover which is a sell indication. Subsequently, RSI also evidences downward convergence to the price slumps which is indicating the strength in prevailing downswings.
To substantiate this bearish stance, MACD on dailies indicates the price slumps to prolong further, the lagging oscillator on monthly terms remains in the bearish trajectory. Overall, we could foresee robust downtrend in the weeks to come.
Trade tips:
Based on above technical reasoning, we recommend shorting rallies on hedging grounds and decide to initiate shorts in futures contracts with near month tenor.
Well, at spot reference: 44.71, contemplating lingering bearish indications, on hedging grounds we recommend shorting near-month month futures as the underlying spot FX likely to target southwards 43.72 levels in near run and 40 levels upon breach below 1st target.
Writers in a futures contract are expected to maintain margins in order to open and maintain a short futures position.







