


 USA at 250: the Black American struggle for life, liberty and the pursuit of happiness
  Buy the Dip: Gold Holds Strong at $3980, Targets $4150
  AI can be a personal trainer in your pocket – but is it safe?
  Goldman Sachs Raises USD/JPY Forecast, Sees Yen Weakness Persist Through 2027
  Vietnam’s population hit the 100 million milestone. Where’s it headed?
  Elon Musk is remaking the world, like Henry Ford before him – but more dangerously
  Bernstein Names IAG, Ryanair as Top European Airline Stocks Ahead of Earnings
  Trump has made more than $1 billion from crypto in a year. How?
  Bank of America Upgrades T-Mobile to Buy, Says LEO Satellite Fears Are Overdone
  Goldman Sachs Says China Competition Weighs More on EU Growth Than Trade Deficit
  Citi Raises TSMC Price Target as AI Chip Demand Strengthens Growth Outlook


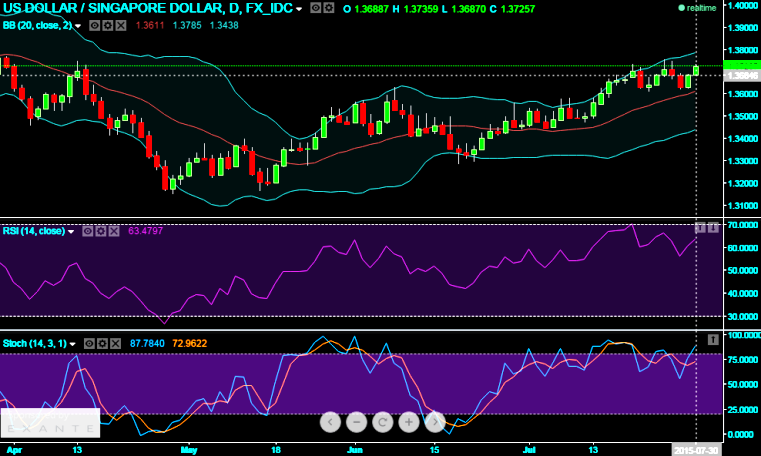
We've been reiterating that the prevailing uptrend for USD/SGD seems to be exhausted in an attempt to evidence 3 month's high but looking weaker as it was unable to sustain the same.
The leading oscillating indicator RSI (14) signals overbought scene as the RSI curve touches 70 levels which is overbought level, the price dips converges the strength index curve.
But on the contrary slow stochastic curve is currently signifying the buying interest back again as %K line crossover near 70 levels.
Since we anticipate the downtrend in this pair, the At-The-Money delta call of USD/SGD value indicates the option's equivalent position in the underlying market.
ATM calls might be luring for many speculators or hedgers at this moment.
Let's suppose for instance, as shown in the diagram USD/SGD ATM call option with Delta +0.5 can be delta hedged by selling 50,000 USD against SGD in the underlying FX market.

- News

- Economy

- Central Banks
- Investing
- Research
- Roundups
- Digital Currency
- Insights
- Technical Analysis
- Technology
- Business
- Law
- Health
- Nature
- Fintech
- Science
- Topic
- Opinions
- ©Econometrics LLC . All Rights Reserved.
FxWirePro: USD/SGD uptrend remains intact; delta hedge to confront puzzling swings
Thursday, July 30, 2015 8:28 AM UTC
Editor's Picks


- Market Data
Most Popular


