


 JPY Currency Meter Signals: NZDJPY Bullish (+25) vs CHFJPY (-100) – These Pairs Could Move Next
  FxWirePro: GBP/AUD gains above 1.9200 level , upside pressure builds
  Major European Indices Score Extremely Bullish: DAX Eyes 26000, CAC Targets 8600, FTSE100 at 11000 – Key Levels to Watch
  FxWirePro:EUR/NZD gains some upside momentum but still bearish
  FxWirePro: NZD/USD firms as Kiwi gains on strong ANZ business outlook data
  FxWirePro:USD/JPY climbs back above 160.00 after BOJ rate decision
  FxWirePro: AUD/USD gains some ground but outlook is bearish
  AUD/JPY Slips Below 112 as BOJ Intervention Sparks Bearish Momentum: Sell the Rallies
  FxWirePro: GBP/AUD drifts lower after BOE rate decision
  FxWirePro: USD/JPY edges higher as focus shifts to BOJ decision
  FxWirePro : GBP/NZD strongly bearish despite upside attempts
  NZDJPY Bullish Rebound: Buy Dips as EMAs Align for 97 Target
  FxWirePro: EUR/AUD regains upwards momentum but unable to hold above 50%fib level
  FxWirePro: AUD/USD dips below lower range, bearish bias increases
  Major FX Action Bias & US Market Sentiment: NZD/USD (Extremely Bullish) & AUD/USD (Bullish) Watchlist
  FxWirePro- Major Pair levels and bias summary
  FxWirePro- Woodies pivot (Major)


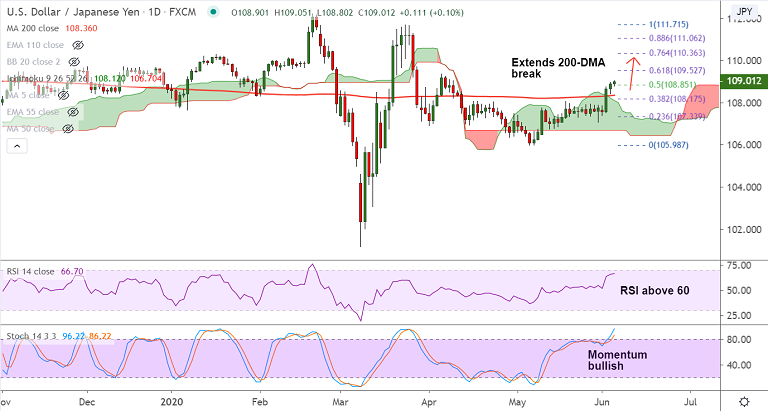
USD/JPY chart - Trading View
USD/JPY has erased early losses and was trading 0.09% higher on the day at 108.99 at around 04:50 GMT.
The pair is extending gains above 200-DMA, scope for test of 61.8% Fib at 109.52.
Rising hopes of economic recovery as lockdowns relaxed across many countries and receding riots in the US support risk-on.
Technical studies have turned bullish after the pair has shown a breakout at 200-DMA.
Rising volatility (as evidenced by widening Bollinger bands) and bullish momentum to drive further gains in the pair.
Next bull target lies at 61.8% Fib at 109.52. Overbought oscillators are something to watch for.
Pullbacks possible, but are likely to be shallow. Major weakness only below 200-DMA.
USD/JPY pair awaits fresh catalysts to extend the 3-day run-up. On the data calendar during the NY session, focus shall be on the US Jobless Claims data for further impetus.
Support levels - 108.59 (55W EMA), 108.36 (200-DMA), 108.07 (110-EMA)
Resistance levels - 109.19 (110W EMA), 109.52 (61.8% Fib), 109.84 (200W MA)
Guidance: Good to go long on dips around 108.80/90, SL: 108.30, target 109.20/ 109.50/ 109.80


