


 FxWirePro: GBP/NZD remains weak, eyes 38.2%fib support
  FxWirePro: EUR/ AUD dips below 1.6400 level, focus on near term support
  Nikkei Surges Past 65,000 on Suspected Yen Weakness: Tech Giants Like Advantest and NEC Lead Explosive Gains
  US Magnificent 7 Stocks Trend Score: Amazon & Microsoft Hit Extreme Bullish (+100) as Meta Drops to -100 — Key Resistance & Support Watchlist
  FxWirePro: GBP/USD rises as soft US data pressures dollar
  FxWirePro: GBP/AUD bears maintain upper hand
  FxWirePro- Major Crypto levels and bias summary
  FxWirePro: USD/ZAR gains as stronger dollar outweighs upbeat South Africa's trade surplus
  FxWirePro: GBP/AUD drifts lower after BOE rate decision
  JPY Currency Meter Signals: NZDJPY Bullish (+25) vs CHFJPY (-100) – These Pairs Could Move Next
  FxWirePro- Major Pair levels and bias summary
  Major European Indices Score Extremely Bullish: DAX Eyes 26000, CAC Targets 8600, FTSE100 at 11000 – Key Levels to Watch
  AUDJPY Volatile After Massive Sell-Off: Sell Rallies at 113, Targeting 110 as Bearish Momentum Surges
  FxWirePro: NZD/USD consolidates overnight gains, but loses momentum
  FxWirePro- Woodies pivot (Major)


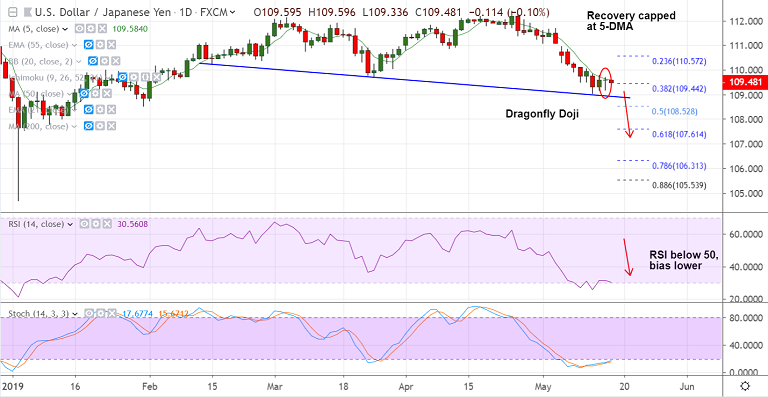
USD/JPY chart - Trading View
- USD/JPY is extending sideways grind as the pair struggles to extend recovery from 3-month lows.
- Risk sentiment remains the main driver for price action. Technical studies still biased lower.
- A 'Dragonfly Doji' on daily charts raises scope for upside. Break above 5-DMA could see some upside.
- The Trump administration laid grounds to ban China’s Huawei from the US telecom sector citing national security threat. US-Iran tension also weighs.
- Price action currently hovers around 1H 21-EMA. 1H 110-EMA at 109.67 is stiff resistance above which we could see gains till 110.52 (21-EMA).
- Failure to build upside momentum could see weakness till 108.90 (falling trendline), ahead of 108.52 (50% Fib).
Support levels - 109, 108.90 (trendline), 108.52 (50% Fib)
Resistance levels - 109.58 (5-DMA), 109.67 (1H 110-EMA), 110.52 (21-EMA)
For details on FxWirePro's Currency Strength Index, visit http://www.fxwirepro.com/currencyindex.


