


 FxWirePro- Major Crypto levels and bias summary
  FxWirePro- Woodies pivot (Major)
  FxWirePro: USD/CAD retreats after Canada posts stronger-than-expected GDP growth
  FxWirePro: USD/ZAR gains as stronger dollar outweighs upbeat South Africa's trade surplus
  FxWirePro: GBP/AUD bears maintain upper hand
  US Magnificent 7 Stocks Trend Score: Amazon & Microsoft Hit Extreme Bullish (+100) as Meta Drops to -100 — Key Resistance & Support Watchlist
  FxWirePro: AUD/USD gains some ground but outlook is bearish
  FxWirePro: EUR/ AUD dips below 1.6400 level, focus on near term support
  FxWirePro:USD/JPY climbs back above 160.00 after BOJ rate decision
  Major European Indices Score Extremely Bullish: DAX Eyes 26000, CAC Targets 8600, FTSE100 at 11000 – Key Levels to Watch
  Major FX Action Bias & US Market Sentiment: NZD/USD (Extremely Bullish) & AUD/USD (Bullish) Watchlist
  FxWirePro- Major Pair levels and bias summary
  JPY Currency Meter Signals: NZDJPY Bullish (+25) vs CHFJPY (-100) – These Pairs Could Move Next
  US Magnificent 7 Stocks Trend Score: Amazon & Microsoft Hit Extreme Bullish (+100) as Meta Drops to -100 — Key Resistance & Support Watchlist
  FxWirePro- Major Pair levels and bias summary
  NZDJPY Retreats on Yen Strength – Bearish Setup Targets 90 After Hitting 92.75 Low


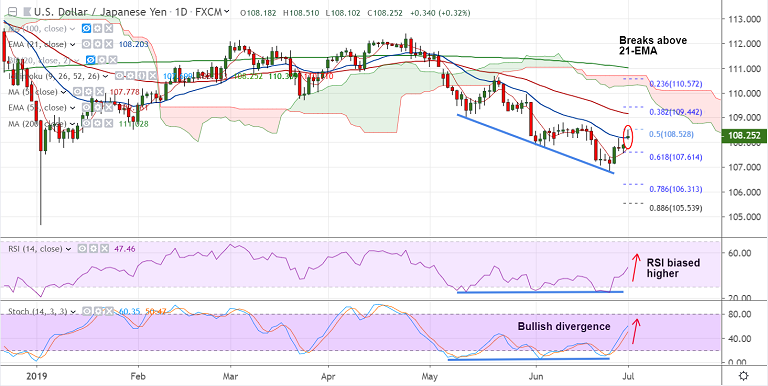
USD/JPY chart - Trading View
USD/JPY opened the week's trade with a bullish gap open on improving risk sentiment.
Hopes of averting U.S-China near-term trade escalation and U.S. and Korea improved relations keep sentiment buoyed.
The major is since struggling to extend gains. Price action has slipped from session highs at 108.51 and is currently trading at 108.28 at 04:15 GMT.
Technical indicators on the daily charts support upside. Stochs and RSI are biased higher.
Further, a bullish divergence on Stochs and RSI keeps scope for upside. A Bullish MACD crossover on signal line adds to the bullish bias.
Decisive close above 21-EMA required for further gains. Next bull target lies at 55-EMA at 109.16.
Major trend is bearish. Failure tp close above 21-EMA and retrace below 5-DMA will see resumption od weakness.
Focus on U.S. ISM manufacturing data due later today for impetus ahead of the crucial NFP data later this week.
Support levels - 108.20 (21-EMA), 107.78 (5-DMA), 107.14 (Lower BB)
Resistance levels - 109, 109.16 (55-EMA), 109.89 (110--EMA)
Recommendation: Watch out for close above 21-EMA to go long, target 109.15.
For details on FxWirePro's Currency Strength Index, visit http://www.fxwirepro.com/currencyindex.


