


 NZDJPY Retreats on Yen Strength – Bearish Setup Targets 90 After Hitting 92.75 Low
  FxWirePro: GBP/AUD drifts lower after BOE rate decision
  FxWirePro: NZD/USD consolidates overnight gains, but loses momentum
  Major FX Action Bias & US Market Sentiment: NZD/USD (Extremely Bullish) & AUD/USD (Bullish) Watchlist
  FxWirePro- Major Crypto levels and bias summary
  FxWirePro:USD/JPY climbs back above 160.00 after BOJ rate decision
  Major European Indices Score Extremely Bullish: DAX Eyes 26000, CAC Targets 8600, FTSE100 at 11000 – Key Levels to Watch
  FxWirePro: EUR/ AUD dips below 1.6400 level, focus on near term support
  NZDJPY Bullish Rebound: Buy Dips as EMAs Align for 97 Target
  FxWirePro- Woodies pivot (Major)
  FxWirePro- Major Crypto levels and bias summary
  FxWirePro: AUD/USD gains some ground but outlook is bearish
  FxWirePro: GBP/AUD bears maintain upper hand
  FxWirePro- Woodies pivot (Major)
  FxWirePro: USD/CNY dips to hit three year low,scope for further downside
  AUDJPY Volatile After Massive Sell-Off: Sell Rallies at 113, Targeting 110 as Bearish Momentum Surges
  FxWirePro: GBP/NZD remains weak, eyes 38.2%fib support


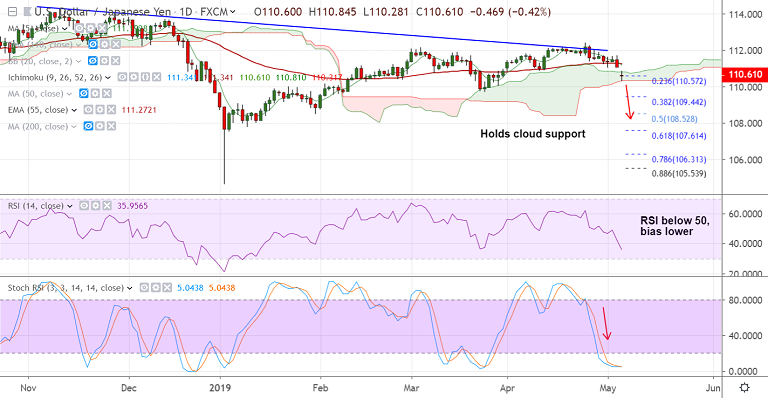
USD/JPY chart - Trading View
- USD/JPY opens the week's trade with a gap down open, bias has turned bearish.
- Greenback dented on renewed US-China trade woes and news of fresh US sanctions on Iran and N. Korea.
- Trump has threatened to slap a 25% tariff on a mind-boggling USD525 billion of Chinese goods by this Friday.
- The pair has however, edged higher from 6-week lows at 110.28 after upbeat China's Caixin services PMI data.
- China's Caixin services PMI for April came in at 54.5 vs. 52.8 expected and 54.4 last. Composite Output Index eased slightly to 52.7 in April from March’s reading of 52.9.
- Japan remains on holiday this Monday, and thin markets could lead to unexpected moves across the board.
- Technical indicators have turned bearish on the daily charts. Stochs and RSI are sharply lower and MACD and DMI support downside.
- The major is currently holding support at daily cloud at 110.31. Break below will see drag till 38.2% Fib at 109.44.
- Cloud top offers immediate resistance at 110.81. Break above 200-DMA required for bearish invalidation.
Support levels - 110.31 (cloud base), 110, 109.44 (38.2% Fib)
Resistance levels - 110.81 (cloud top), 111, 111.19 (converged 5-DMA and 55-EMA)
Recommendation: Stay short on break below daily cloud, SL: 110.85, TP: 110/ 109.45
For details on FxWirePro's Currency Strength Index, visit http://www.fxwirepro.com/currencyindex.


