


 JPY Currency Meter Signals: NZDJPY Bullish (+25) vs CHFJPY (-100) – These Pairs Could Move Next
  AUDJPY Volatile After Massive Sell-Off: Sell Rallies at 113, Targeting 110 as Bearish Momentum Surges
  FxWirePro- Major Pair levels and bias summary
  US Magnificent 7 Stocks Trend Score: Amazon & Microsoft Hit Extreme Bullish (+100) as Meta Drops to -100 — Key Resistance & Support Watchlist
  FxWirePro- Major Pair levels and bias summary
  FxWirePro: AUD/USD gains some ground but outlook is bearish
  NZDJPY Retreats on Yen Strength – Bearish Setup Targets 90 After Hitting 92.75 Low
  FxWirePro: USD/CNY dips to hit three year low,scope for further downside
  FxWirePro: EUR/ AUD dips below 1.6400 level, focus on near term support
  FxWirePro- Woodies pivot (Major)
  Nikkei Surges Past 65,000 on Suspected Yen Weakness: Tech Giants Like Advantest and NEC Lead Explosive Gains
  NZDJPY Bullish Rebound: Buy Dips as EMAs Align for 97 Target
  Major FX Action Bias & US Market Sentiment: NZD/USD (Extremely Bullish) & AUD/USD (Bullish) Watchlist
  FxWirePro: GBP/AUD bears maintain upper hand
  FxWirePro:USD/JPY climbs back above 160.00 after BOJ rate decision
  FxWirePro: USD/ZAR gains as stronger dollar outweighs upbeat South Africa's trade surplus


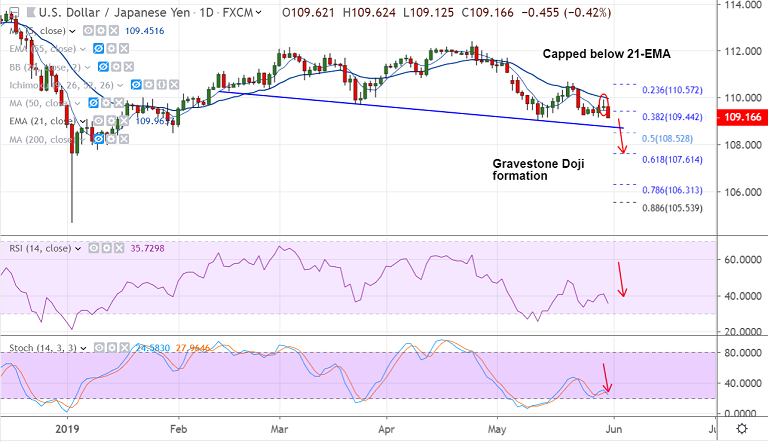
USD/JPY chart - Trading View
USD/JPY slumps in the Asian session to hit 2-week lows at 109.12.
The pair dives as China's retaliation plan strengthens bid tone around JPY.
China said that it is ready with a plan to limit rare earth exports to the US if needed.
Technical studies have always been bearish as noted in our previous article.
Upside has been capped below 21-EMA and technical charts are biased lower.
A 'Dravestone Doji' formation on daily charts seen on Thursday's candle.
Scope for test of trendline support at 108.75. Break below will see further weakness.
Support levels - 108.75 (Falling Trendline), 108, 107.61 (61.8% Fib)
Resistance levels - 109.45 (5-DMA), 109.96 (21-EMA), 110
For details on FxWirePro's Currency Strength Index, visit http://www.fxwirepro.com/currencyindex.


