


 GBPJPY Coil Tightens: Is a Bullish Break Above 215.60 Imminent?
  FxWirePro: AUD/ USD strongly bearish despite upside attempts
  Ethereum Cracks Under $1,700: Sell the Rally Near $1,750 as Bears Eye $1,380–$1,200
  FxWirePro: EUR/ NZD uptrend loses steam, remains on bullish path
  FxWirePro- Major Pair levels and bias summary
  FxWirePro: GBP/NZD stuck in range but outlook is bullish
  BTC’s Bear Bounce: Sell the Rally Near $66K as Bears Target $59K–$52K Breakdown
  FxWirePro: USD/CAD steadies around 1.3990 ,retains bid one
  Relief Rally Extends to 112.75, but AUDJPY EMA Structure Favors Selling
  FxWirePro: AUD/USD climbs as US-Iran peace deal sparks risk rally
  FxWirePro: USD/JPY gains above 160 level ahead of BOJ policy meeting
  FxWirePro: USD/ CNY falls towards 6.750, bears keep the advantage
  FxWirePro: GBP/AUD runs out of steam but maintains bullish outlook
  FxWirePro- Major Crypto levels and bias summary


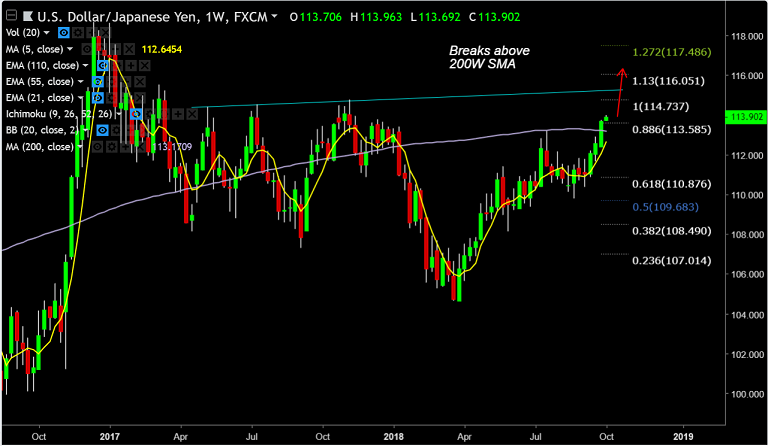
USD/JPY chart on Trading View used for analysis
- USD/JPY extends gains for the 4th straight week, hits 11-month highs at 113.96.
- Data from the United States last week has been upbeat, confirming the Fed's hawkish stance.
- Core-PCE price index, the Fed's preferred measure of inflation, rose 2% y/y in August to match the previous reading and in-line with consensus.
- Technical studies are highly bullish, we see scope for further gains. Price action has broken major resistance at 200W -SMA.
- Next major bull target lies at 115.30 (trendline resistance). Further bullishness only on break above.
- 5-DMA is immediate support at 113.32, while major support lies at 111.01 (100-DMA).
Support levels - 113.32 (5-DMA), 113.17 (200W SMA), 112.38 (21-EMA)
Resistance levels - 114, 114.74 (Nov 6 2017 high), 115, 115.30 (trendline)
Recommendation: Good to stay long on dips, SL: 112.35, TP: 114/ 114.75/ 115/ 115.30
FxWirePro Currency Strength Index: FxWirePro's Hourly USD Spot Index was at 84.0683 (Bullish), while Hourly JPY Spot Index was at 13.7878 (Neutral) at 0330 GMT.
For more details on FxWirePro's Currency Strength Index, visit http://www.fxwirepro.com/currencyindex.


