


 Crypto Action Bias: ETHUSD Stands Out as the Bullish Pair to Watch
  FxWirePro: GBP/AUD downside pressure builds, key support level in focus
  FxWirePro: EUR/ AUD gains some ground , but remains on bearish path
  FxWirePro- Woodies pivot (Major)
  EUR/JPY Holds Bullish Bias as Euro Extends Recovery
  EUR/USD Bounces from Monthly Low, But Bearish Pressure Remains
  FxWirePro: EUR/AUD outlook weaker on renewed downside pressure
  FxWirePro: USD/ZAR uptrend loses steam, remains on bullish path
  FxWirePro: GBP/USD edges higher as traders await BoE guidance and UK fiscal clarity
  FxWirePro: USD/CAD gaining momentum for a move towards 1.4200 level
  FxWirePro : USD/JPY holds relatively bid on 163 ahead Of FOMC,BoJ meetings
  FxWirePro- Woodies pivot (Major)
  FxWirePro: USD/ZAR retreats but trend is still bullish
  FxWirePro- Major Pair levels and bias summary
  FxWirePro- Major Crypto levels and bias summary
  FxWirePro: NZD/USD edges lower, remains on back foot


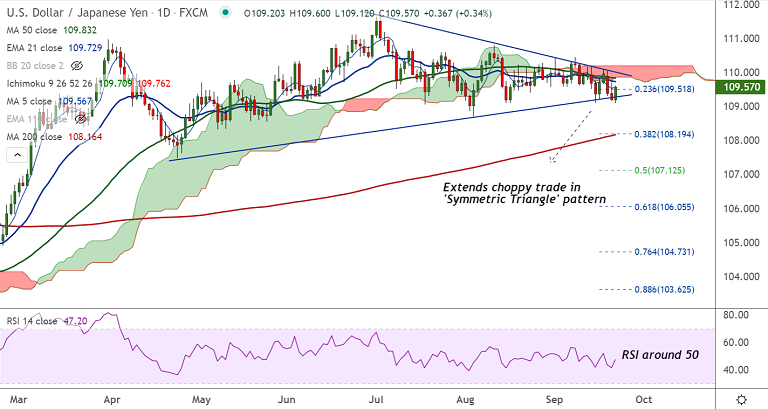
USD/JPY chart - Trading View
Spot Analysis:
USD/JPY was trading 0.36% higher on the day at 109.58 at around 06:40 GMT
Previous Week's High/ Low: 110.16/ 109.11
Previous Session's High/ Low: 109.70/ 109.18
Fundamental Overview:
The Bank of Japan (BOJ) kept benchmark interest rate unchanged at -0.10%, in line with wide market expectations.
The central bank revised down economic outlook on virus woes, adding that Japan's economy is likely to recover as impact of pandemic gradually subsides.
Earlier in the day, the International Monetary Fund’s (IMF) Chief Economist Gita Gopinath also sounded optimistic over China’s ability to tame the fears emanating from the real-estate firm.
Risk sentiment buoyed as Evergrande hints at paying the coupon on onshore bonds at the September 23 expiry.
Technical Analysis:
- USD/JPY bounces off 'Symmetric Triangle' base
- The pair has been grinding sideways along 21-week EMA support
- Price action is below daily Ichimoku cloud
- Momentum studies are bearish and volatility is shrinking with scope for breakout
Major Support and Resistance Levels:
Support - 108.74 (200-week MA), Resistance - 109.73 (21-EMA)
Summary: USD/JPY keep its recovery momentum intact as markets remain risk-on after Evergrande hints at coupon payment.
FOMC meeting will be the crucial deciding factor for price movement. Break out of 'Symmetric Triangle' pattern will provide a clear directional bias for the pair.


