


 FxWirePro: GBP/USD edges higher as traders await BoE guidance and UK fiscal clarity
  FxWirePro- Major Pair levels and bias summary
  FxWirePro: GBP/AUD gains some upside momentum but still bearish
  FxWirePro: USD/ZAR retreats but trend is still bullish
  FxWirePro: USD/ CNY remains soft ahead of Fed decision
  Major Forex Pairs Action Bias: GBPUSD and AUDUSD Turn Extremely Bearish
  FxWirePro: USD/CAD runs out of steam but maintains bullish outlook
  FxWirePro: EUR/ AUD gains some ground , but remains on bearish path
  FxWirePro: GBP/AUD downside pressure builds, key support level in focus
  JPY Pairs Action Bias: EURJPY Leads as Bullish Standout Amid Mixed Momentum
  JPY Action Bias: USDJPY Emerges as the Clear Bullish Pair to Watch Amid Mixed Crosses
  FxWirePro: NZD/USD neutral in the near-term, scope for downward resumption
  FxWirePro: USD/JPY eases ahead of Fed decision , Intervention risks linger
  FxWirePro : USD/JPY holds relatively bid on 163 ahead Of FOMC,BoJ meetings
  FxWirePro- Woodies pivot (Major)


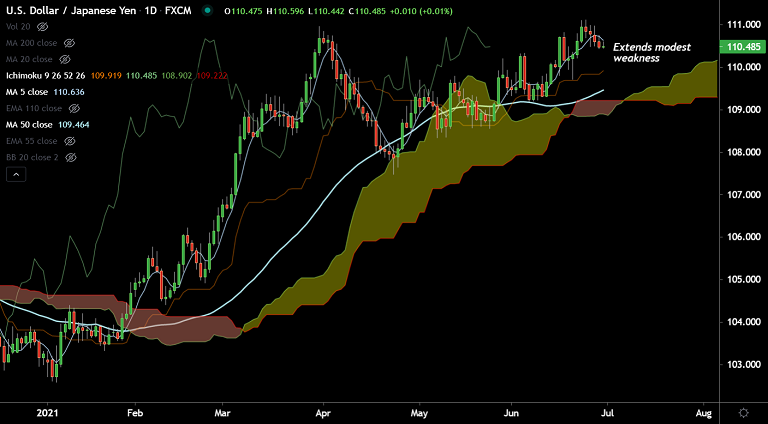
USD/JPY chart - Trading View
Technical Analysis: Bias Bearish
GMMA Indicator
- Hourly Charts: Major and minor trend are bearish
- Daily Charts: Major trend is bullish, minor trend is neutral
- Weekly Charts: Major and minor trend are strongly bullish
Ichimoku Analysis
- Tenkan Sen: 110.41
- Kijun Sen: 109.91
- Chikou Span: 110.48
- Price action is above cloud and is holding support at Tenkan Sen, Chikou span is flatlined
Oscillators
- Stochs and RSI are in neutral territory
- Stochs are on verge of rollover from overbought levels
Bollinger Bands
- Bollinger bands are wide and indicate high volatility
Major Support Levels: 110.41 (Tenkan Sen), 110.19 (21-EMA), 110 (Trendline)
Major Resistance Levels: 110.63 (5-DMA), 111 (Psychological mark), 111.20 (Upper BB)
Summary: USD/JPY was extending weakness for the 5th straight session, near-term outlook bearish. Upside remains capped at 5-DMA, the pair is on track to test 21-EMA support at 110.19.


