


 Crypto Action Bias: ETHUSD Stands Out as the Bullish Pair to Watch
  Buy the Dips on EUR/JPY: Bullish Structure Points to 188 Target Ahead of Fed
  FxWirePro: GBP/NZD maintains bersish bias with focus on 2.2900 level
  NZD/JPY Flatlines Near 94.60: Will Key Support Reignite the Uptrend?
  FxWirePro: GBP/USD edges higher as traders await BoE guidance and UK fiscal clarity
  JPY Action Bias: USDJPY Emerges as the Clear Bullish Pair to Watch Amid Mixed Crosses
  Major Pairs Action Bias: USDCAD and USDCHF Stand Out as Extremely Bullish While GBPUSD and NZDUSD Turn Extremely Bearish
  Major Forex Pairs Action Bias: GBPUSD and AUDUSD Turn Extremely Bearish
  FxWirePro- Woodies pivot (Major)
  FxWirePro: AUD/USD falls after softer-than-expected Australian Q2 CPI
  AUDJPY Weakness Deepens: Sell Rallies Toward 112 as Aussie Dollar Falters
  FxWirePro: USD/ZAR firms ahead of Fed interest rate decision
  NZDJPY Pullback: Sell Rallies Toward 93.30 as Yen Weakness Eases
  FxWirePro: AUD/USD dips after RBA Governor speech
  FxWirePro: EUR/ AUD gains some ground , but remains on bearish path
  EUR/JPY Holds Bullish Bias as Euro Extends Recovery


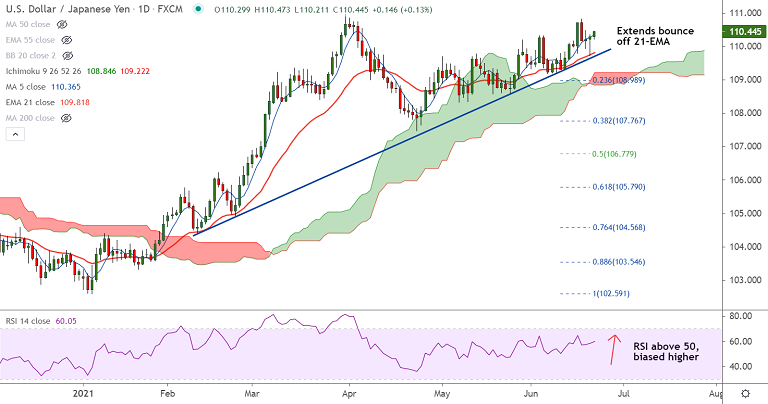
USD/JPY chart - Trading View
Spot Analysis:
USD/JPY was trading 0.12% higher on the day at 110.42
Previous Week's High/ Low: 110.82/ 109.60
Previous Session's High/ Low: 110.35/ 109.71
Fundamental Overview:
US dollar on the front-foot as investors turn optimistic following the latest Fedspeak.
Also favoring the market sentiment could be firmer US Treasury yields and easing covid woes in Asia.
US 10-year Treasury yields stay firmer after bouncing off a four-month low the previous day.
Focus now on Fed Chair Jerome Powell’s testimony to confirm no threats to the easy money policies.
Technical Analysis:
- USD/JPY has bounced off 21-EMA with hammer formation on the previous session's candle
- GMMA indicator shows major and minor trend are strongly bullish
- MACD and ADX support gains, momentum is bullish
- Price action is above cloud and Chikou span is biased higher
Major Support and Resistance Levels:
Support - 110 (200H MA), 109.81 (21-EMA), 109.21 (55-EMA)
Resistance - 110.66 (Upper BB), 110.75 (Trendline), 111.39 (76.4% Fib)
Summary: USD/JPY is poised to resume upside. Technicals favour bulls. Focus on Powell's testimony for impetus. Break above trendline resistance will buoy bulls.


