


 FxWirePro: AUD/USD uptrend loses steam, remains on bearish path
  AUDJPY Extends Four-Day Rally on Yen Weakness: Bullish Dip-Buy Eyes 117-118
  FxWirePro :USD/JPY eases slightly, remains on bullish path
  FxWirePro: GBP/AUD bears maintain upper hand
  FxWirePro: GBP/NZD downside pressure builds, key support levels in focus
  FxWirePro: EUR/AUD neutral in the near term, scope for downward resumption
  FxWirePro: NZD/USD gains as U.S.-Iran peace hopes boost risk sentiment
  FxWirePro: EUR/NZD firms after ECB holds rates steady at 2.25%
  Major Pairs Action Bias: USDCHF Emerges Extremely Bullish as EURUSD and GBPUSD Turn Deeply Bearish
  FxWirePro: USD/CNY dips as yuan firms on improving risk appetite
  FxWirePro: AUD/USD gains on Iran-US truce hopes, risk rally
  FxWirePro: USD/CNY edges higher but bulls lack punch
  FxWirePro- Major Crypto levels and bias summary
  FxWirePro- Major Crypto levels and bias summary
  Major Pair Action Bias: Bullish Pairs to Watch Out For
  FxWirePro- Woodies pivot (Major)


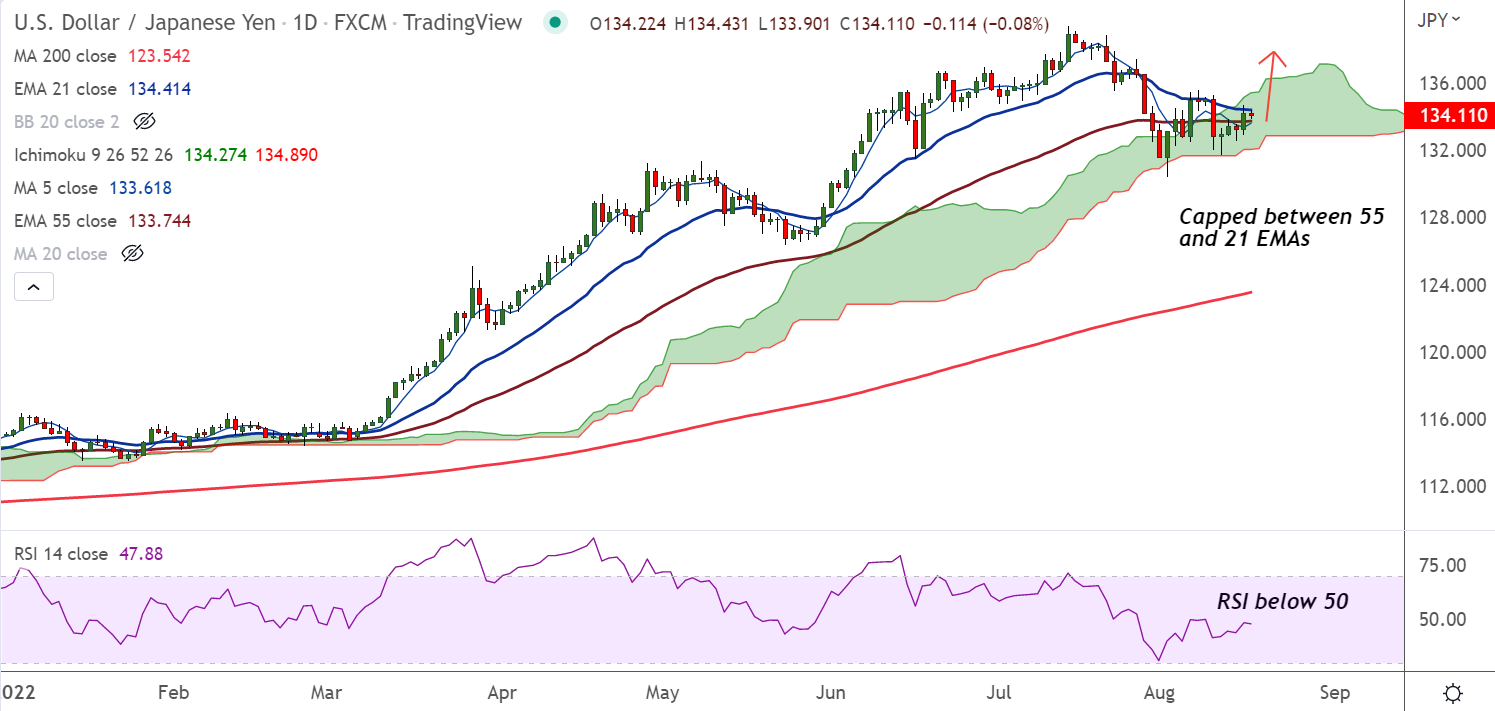
Chart - Courtesy Trading View
Spot Analysis:
USD/JPY was trading rangebound at 134.15, with session high at 134.43 and low at 133.90
Previous Week's High/ Low: 135.58/ 131.73
Previous Session's High/ Low: 134.68/ 132.94
Fundamental Overview:
Investors turn cautious and refrain from placing any big bets as they await the FOMC meeting minutes.
Fed minutes will be watched for any insights on the size of the rate hike in the upcoming meetings.
For September, markets are pricing in a 58% chance of a 50 basis point Fed rate hike.
Technical Analysis:
- USD/JPY capped between 55 and 21 EMAs, breakout will provide clear directional bias
- GMMA indicator shows major and minor trend are neutral on the daily charts
- 5-DMA is biased higher and momentum is bullish, stochs and RSI are biased higher
- Price action is within the daily cloud, breach below cloud will negate any further upside
- MACD is on verge of bullish crossover on signal line
Major Support and Resistance Levels:
Support - 133.61 (5-DMA), Resistance - 134.41 (21-EMA)
Summary: USD/JPY trades with a neutral bias. Decisive break out required to determine further direction.


