


On daily plotting, hammer pattern candle occurred at 112.778 levels.
Ever since the occurrence of this bullish pattern, bulls have been gaining the momentum in upswings.
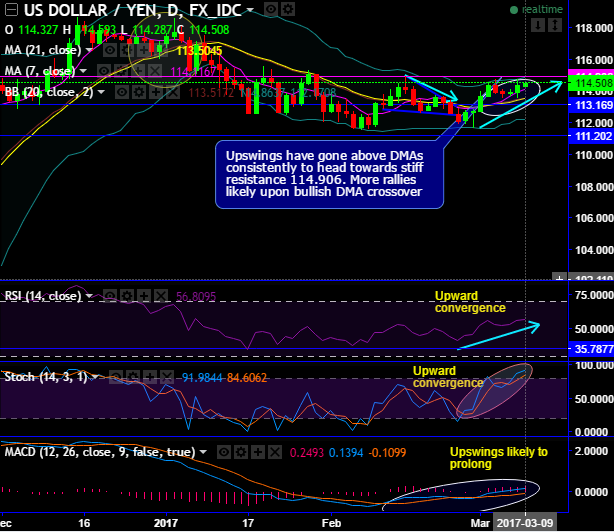
These upswings have gone above DMAs consistently to head towards stiff resistance 114.906. More rallies likely upon bullish DMA crossover.
On monthly terms, the uptrend has gone above 21EMA, expect more rallies upon breach above stiff resistance and bullish EMA crossover.
Short term trend is mildly bullish bias as long as immediate supports at 112.0661 (7EMA) maintains convincingly.
MACD on the hand also indicates the bull trend to prolong further. Hence, we could foresee the retest of recent highs of 118.608 is quite possible.
So, add longs in futures contracts with mid-month tenors to arrest these potential upside risks ahead of Fed’s hiking cycle.


