


 JPY Action Bias: USDJPY Emerges as the Clear Bullish Pair to Watch Amid Mixed Crosses
  AUDJPY Weakness Deepens: Sell Rallies Toward 112 as Aussie Dollar Falters
  GBPJPY Slips After Sterling Weakness, Bears Eye 216
  FxWirePro: NZD/USD edges lower, remains on back foot
  FxWirePro: EUR/NZD downside pressure builds, key support level in focus
  NZDJPY Pullback: Sell Rallies Toward 93.30 as Yen Weakness Eases
  FxWirePro: AUD/USD gains on Iran-US truce hopes, risk rally
  Major Pair Action Bias: Bullish Pairs to Watch Out For
  FxWirePro: USD/CNY dips as yuan firms on improving risk appetite
  FxWirePro: AUD/USD dips after RBA Governor speech
  JPY Action Bias: Bullish Pairs to Watch Out For
  FxWirePro: USD/ZAR uptrend loses steam, remains on bullish path
  FxWirePro :USD/JPY eases slightly, remains on bullish path
  FxWirePro: NZD/USD gains as U.S.-Iran peace hopes boost risk sentiment
  FxWirePro- Major Pair levels and bias summary
  FxWirePro: EUR/AUD outlook weaker on renewed downside pressure


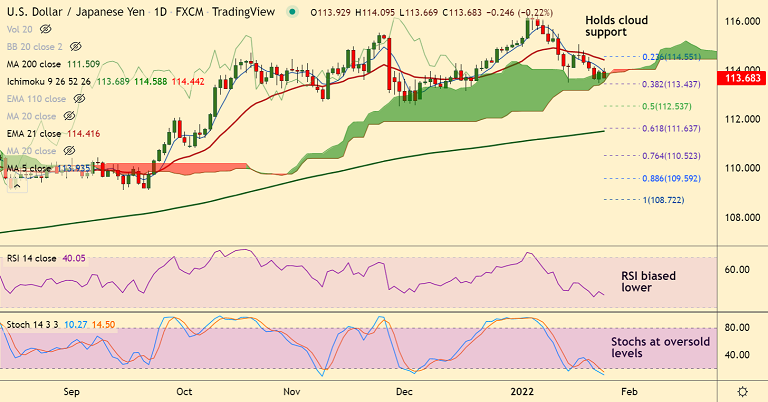
Chart - Courtesy Trading View
Technical Analysis: Bias Bearish
GMMA Indicator
- Major trend is neutral, while minor trend is bearish
Ichimoku Analysis
- Price action is holding support at daily cloud
- Chikou span is biased lower
Oscillators
- Momentum oscillators are strongly bearish
- RSI is below 50 and biased lower, Stochs are at oversold
Bollinger Bands
- Bollinger bands are spread wide apart
- Volatility is high and rising
Major Support Levels: 113.43 (38.2% Fib), 113.35 (Lower BB), 113.14 (110-EMA)
Major Resistance Levels: 113.93 (5-DMA), 114.41 (21-EMA), 114.55 (23.6% Fib)
Summary: USD/JPY extends sideways at cloud support, break below will see more weakness. Technical bias is bearish, scope for test of 110-EMA at 113.14. Bearish invalidation only above 21-EMA.


