


US oil chart on Trading View used for analysis
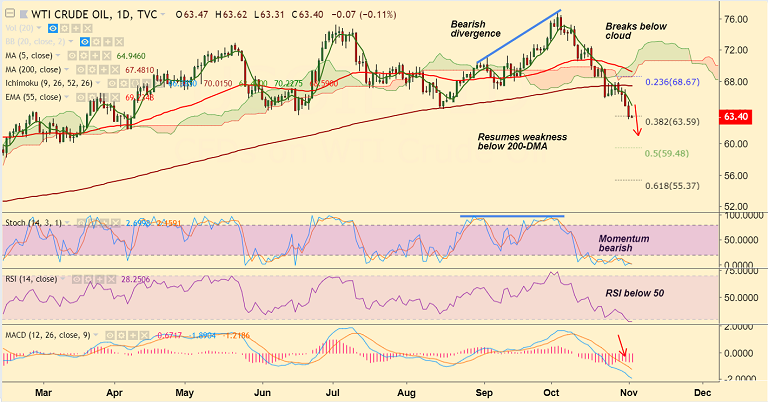
- US oil is trading in an extremely narrow range around 38.2% Fib support.
- Price has hit 6-month lows at 63.15 before paring some losses to currently trade at 63.35.
- Crude oil faced a strong selloff on Thursday as rising oil output in the U.S. continued to weigh on prices.
- Rising US crude supplies combined with global growth concerns continue to undermine the sentiment.
- The US EIA data showed that the US crude oil inventories climbed for a sixth straight week.
- The output rose to a record high of 11.2 million barrels per day to force crude oil prices to extend their fall.
- The pair is extending break below 200-DMA and now hovers around major support at 38.2% Fib at 63.59.
- Technical studies support weakness, momentum studies are bearish. Break below 38.2% Fib to extend weakness. Scope for test of 62 levels.
Support levels - 63.59 (38.2% Fib), 61.84 (Apr 6 low), 59.48 (50% Fib)
Resistance levels - 64, 64.94 (5-DMA), 67.48 (200-DMA)
For details on FxWirePro's Currency Strength Index, visit http://www.fxwirepro.com/currencyindex.


