


 FxWirePro: GBP/NZD maintains bersish bias with focus on 2.2900 level
  FxWirePro: USD/CAD runs out of steam but maintains bullish outlook
  FxWirePro- Major Pair levels and bias summary
  FxWirePro: GBP/AUD gains above 1.9200 level , upside pressure builds
  FxWirePro: GBP/USD edges lower ahead of Fed policy verdict
  NZD/JPY Flatlines Near 94.60: Will Key Support Reignite the Uptrend?
  FxWirePro: EUR/AUD regains upwards momentum but unable to hold above 50%fib level
  NZDJPY Bullish Rebound: Buy Dips as EMAs Align for 97 Target
  FxWirePro:EUR/NZD gains some upside momentum but still bearish
  FxWirePro- Woodies pivot (Major)
  FxWirePro: USD/ CNY hits one-month low,scope for futher downside
  EURUSD Spikes to 1.14306 on Fed Pause as Traders Eye Sell-the-Rally Setup
  Buy the Dips on EUR/JPY: Bullish Structure Points to 188 Target Ahead of Fed
  FxWirePro: USD/JPY edges higher as focus shifts to BOJ decision
  FxWirePro : GBP/NZD strongly bearish despite upside attempts
  JPY Action Bias: EURJPY and CADJPY Emerge as Extremely Bullish Pairs to Watch


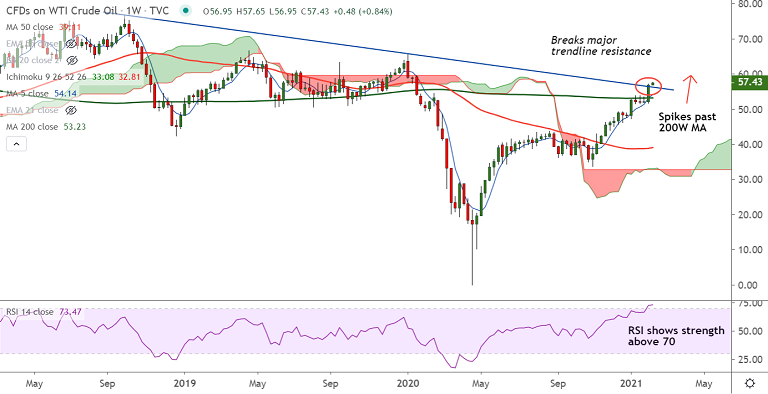
USOIL chart - Trading View
WTI crude prices hit new 13-month high as prices extend winning streak for the 7th consecutive session.
Oil price buoyed as Iran hints proposal to increasing arms embargo if the US fails to recall the sanctions and settle the terms of the 2015 nuclear deal.
The weekly charts confirm a bullish breakout above major trendline resistance at 53.45.
Analysis of GMMA indicator shows major and minor trend are strongly bullish and volatility is rising on the daily and weekly charts.
Price are set to test 110 month EMA resistance at 58.63. Decisive break above will propel the pair higher.







