


 FxWirePro: NZD/USD retreats as Middle East instability weighs
  Bitcoin Reclaims $65,000 as Easing Geopolitical Tensions Fuel Risk-On Rally
  EURGBP Bears Break Trendline: Sell Rallies at 0.8578 as Support Breach Eyes 0.8450 Slide
  FxWirePro: AUD/USD eases as investors await U.S. employment figures
  FxWirePro- Major Pair levels and bias summary
  FxWirePro- Woodies pivot (Major)
  Major Pair Currency Score: NZD/USD and AUD/USD Lead Forex Rally with Perfect 100 Scores
  FxWirePro: USD/ZAR gains some ground, but downtrend remains
  FxWirePro: EUR/AUD slips after surprise U.S. employment data
  FxWirePro: USD/CNY slips as strong China exports data Lift yuan
  FxWirePro: EUR/ AUD neutral in the near term, scope further downside
  FxWirePro: USD/JPY holds tight range ahead of key U.S. payrolls data
  FxWirePro : EUR/NZD slips lower after soft US jobs report
  FxWirePro- Major Pair levels and bias summary


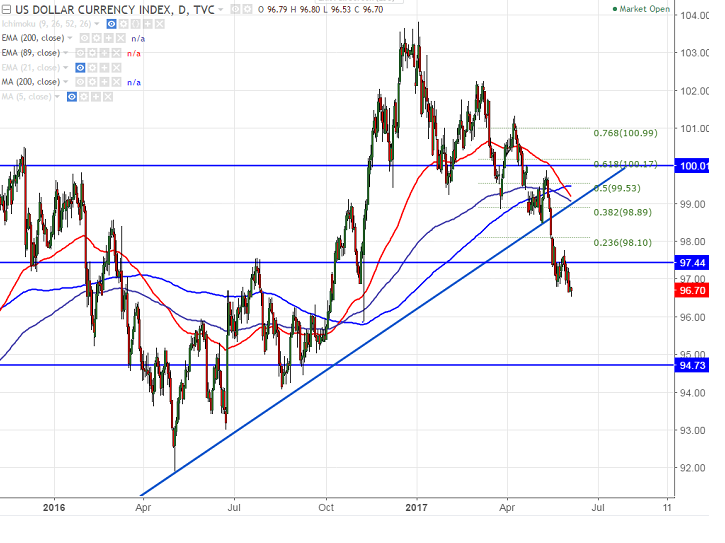
- US Dollar index has broken the triple bottom at 96.80 and declined till 96.53. It is currently trading around 96.63.
- Short term trend is still weak as long as index not able to break above 98.08 (23.6% fibo). The index has shown a huge decline from the high 103.82 and downside capped by 61.8% fibo at 96.40 and bearish continuation can be seen below that level.
- The near term resistance is around 97.80 (21 – day EMA) and any close above will take the index till 98.60 (support turned into resistance)/ 99.46 (200 MA)/99.89.
- On the lower side, major near term support is around 96.40 (61.8% fibo) and any break below will drag the index till 95.91 (Nov 9th 2016 low)/95.
It is good to sell on rallies around 97.25-97.30 with SL around 97.80 for the TP of 96.40/95.90.







