


 FxWirePro: GBP/NZD remains weak, eyes 38.2%fib support
  JPY Currency Meter Signals: NZDJPY Bullish (+25) vs CHFJPY (-100) – These Pairs Could Move Next
  FxWirePro- Woodies pivot (Major)
  FxWirePro: EUR/ AUD dips below 1.6400 level, focus on near term support
  FxWirePro- Major Pair levels and bias summary
  NZDJPY Retreats on Yen Strength – Bearish Setup Targets 90 After Hitting 92.75 Low
  FxWirePro: NZD/USD consolidates overnight gains, but loses momentum
  FxWirePro: USD/CNY dips to hit three year low,scope for further downside
  FxWirePro- Woodies pivot (Major)
  Major European Indices Score Extremely Bullish: DAX Eyes 26000, CAC Targets 8600, FTSE100 at 11000 – Key Levels to Watch
  Major FX Action Bias & US Market Sentiment: NZD/USD (Extremely Bullish) & AUD/USD (Bullish) Watchlist
  US Magnificent 7 Stocks Trend Score: Amazon & Microsoft Hit Extreme Bullish (+100) as Meta Drops to -100 — Key Resistance & Support Watchlist
  FxWirePro: GBP/AUD bears maintain upper hand
  NZDJPY Bullish Rebound: Buy Dips as EMAs Align for 97 Target
  FxWirePro: GBP/USD rises as soft US data pressures dollar
  FxWirePro- Major Pair levels and bias summary


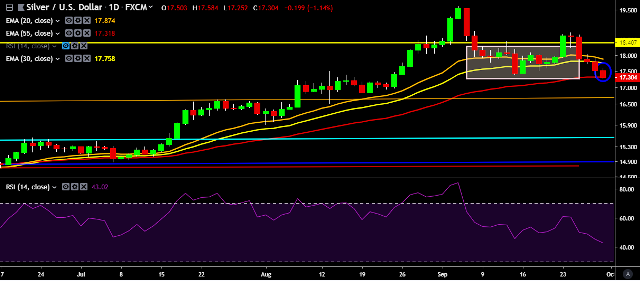
- XAG/USD is currently trading around $17.27 marks.
- It made intraday high at $17.58 and low at $17.25 levels.
- Intraday bias remains bearish till the time pair holds key resistance at $17.62 mark.
- A daily close above $17.50 will test key resistances at $17.87, $18.02, $18.17, $18.45, $18.76, $19.07 and $19.27 marks respectively.
- On the other side, a daily close below $17.50 will take the parity down towards key supports at $17.26, $17.07, $16.94 and $16.72 marks respectively.
- Important to note here that 20D, 30D and 55D EMA heads up and confirms the bullish trend in a daily chart. Current downside movement is short term trend correction only.
We prefer to take short position on XAG/USD around $17.30, stop loss at $17.59 and target of $17.07/$16.94.


