


 FxWirePro- Woodies pivot (Major)
  FxWirePro:GBP/USD recovers slightly from early decline but bears are not done yet
  FxWirePro- Major Pair levels and bias summary
  FxWirePro: USD/CAD hits 14-month high , Scope for further upside
  FxWirePro: EUR/AUD bullish outlook with scope to target 1.6550
  FxWirePro : GBP/NZD uptrend loses steam, remains on bullish path
  FxWirePro- Major Pair levels and bias summary
  NZDJPY Bears Reload as 92 Resistance Caps Bounce; Sell-on-Rallies Eyed Toward 90
  FxWirePro: GBP/USD heads deeper into bear territory, 23.6% fibonacci eyed
  FxWirePro- Major Crypto levels and bias summary
  FxWirePro: NZD/USD extends losing run, eyes 0.5600 level
  FxWirePro: GBP/NZD gaining momentum for a move towards 2.3100 level
  FxWirePro:NZD/USD rout continues without relief
  FxWirePro- Woodies pivot (Major)
  FxWirePro: USD/JPY dips as Japanese Yen consolidates near 40-year low
  GBPJPY Caught in a Tight Range: Bearish EMAs Suggest a Breakout Awaits


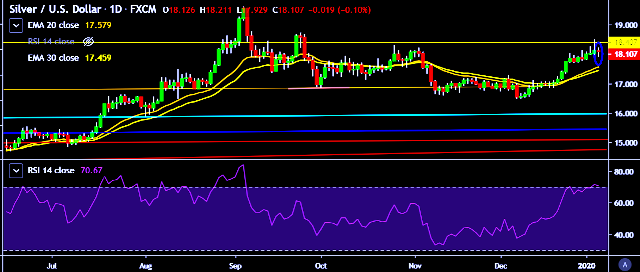
- XAG/USD is currently trading around $18.09 marks.
- It made intraday high at $18.21 and low at $17.92 levels.
- Intraday bias remains neutral for the moment.
- A daily close above $18.20 will test key resistances at $18.49, $18.65, $18.87 and $18.98 marks respectively.
- On the other side, a daily close below $18.12 will take the parity down towards key supports at $17.92, $17.74, $17.62, $17.35 and $17.17 marks respectively.
- Important to note here that 20D, 30D and 55D EMA heads up and confirms the bullish trend in a daily chart.
We prefer to take long position on XAG/USD around $18.05, stop loss at $17.90 and target of $18.49/$18.65.


