


 FxWirePro: USD/CAD extends decline on broad dollar weakness
  FxWirePro- Major Pair levels and bias summary
  FxWirePro- Major Crypto levels and bias summary
  FxWirePro- Woodies Pivot(Major)
  NZDJPY Bulls Charge Toward 95.00: Safe-Haven Exodus Drives Kiwi Rally
  FxWirePro- Major Pair levels and bias summary
  FxWirePro: GBP/NZD down trend loses steam, remains on bearish path
  FxWirePro: USD/ZAR recovers slightly but trend is still bearish
  FxWirePro: EUR/AUD under pressure as key support gives way
  Euro Holds the Line: EURUSD Finds Support at the 365-EMA as Peace Talks Loom
  Bitcoin’s Volatile Reset: ETFs Rebound as Bulls Eye USD 80,000 Milestone
  FxWirePro- Major European Indices
  FxWirePro: USD/CAD recovers slightly but bearish outlook persists
  FxWirePro- Woodies Pivot(Major)
  FxWirePro: GBP/USD bulls remain cautiously optimistic


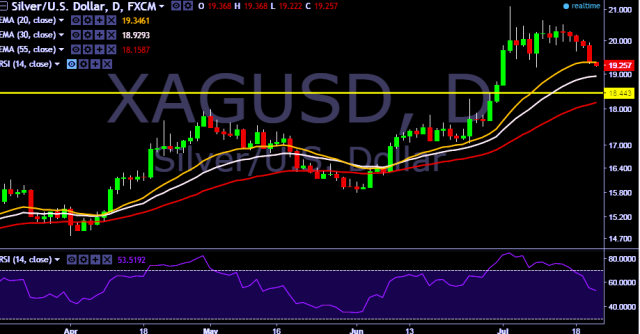
- XAG/USD is currently trading around $19.27 marks.
- It made intraday high at $19.36 and low at $19.22 levels.
- Intraday bias remains bearish till the time pair holds key resistance at $19.96 levels.
- A daily close above $20.20 tests key resistances at $20.32, $20.45, $20.66, $20.78, $21.09 and $21.46 marks respectively.
- On the other side, a daily close below $19.20 will take the parity down towards key supports at $19.12, $19.09, $18.87 and $18.68 marks respectively.
- Important to note here that in a daily chart, 20D, 30D and 55D EMA heads up and confirms the bullish trend. Current downside movement is short term trend correction only.
We prefer to take short position in XAG/USD around $19.27 with stop loss at $19.68 and target of $18.87.


