


 FxWirePro: EUR/CAD gains ground on prospects of resumed energy flows
  FxWirePro- Woodies Pivot(Major)
  FxWirePro- Woodies Pivot(Major)
  FxWirePro- Major Pair levels and bias summary
  FxWirePro: USD/JPY holding bid into weekend
  FxWirePro: GBP/NZD down trend loses steam, remains on bearish path
  FxWirePro: USD/ZAR edges lower ,investors remain on edge
  FxWirePro- Major European Indices
  Energy Surge Ignites US Inflation: USDCHF Eyes Support Amid Dollar Sell-Off
  FxWirePro: GBP/USD biased higher but rally currently stretched
  FxWirePro: GBP/AUD gains some upside momentum but still bearish
  NZDJPY Bulls Charge Toward 95.00: Safe-Haven Exodus Drives Kiwi Rally
  FxWirePro: EUR/AUD under pressure as key support gives way
  FxWirePro: USD/CAD extends decline on broad dollar weakness
  FxWirePro- Major Pair levels and bias summary
  FxWirePro: AUD/USD retreats slightly but trend is still bullish


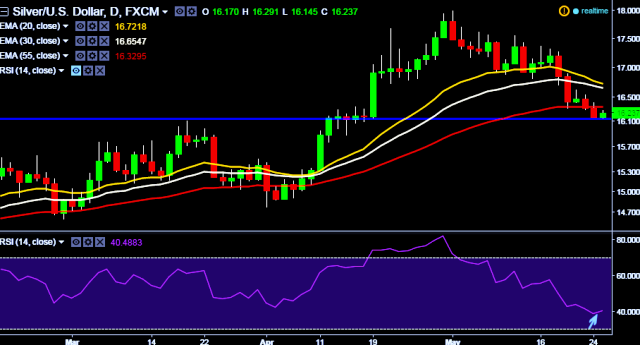
- XAG/USD is currently trading around $16.26 marks.
- It made intraday high at $16.29 and low at $16.14 levels.
- Intraday bias remains bullish till the time pair holds key support at $16.15 marks.
- A daily close below $16.15 will take the parity down towards key support at $15.72 marks.
- Alternatively, reversal from key support $16.15 will take the parity higher towards key resistances at $16.32, $16.45, $16.63, $16.88 (20D, 30D and 55D EMA cross over), $16.95, $17.11, $17.46 (May 09, 2016 high) and $17.55 (May 11, 2016 high) levels respectively.
- Important to note here that in a daily chart, 20D, 30D and 55D EMA heads up and confirms bullish trend. Current downside movement is short term trend correction only.
We prefer to take long position in XAG/USD around $16.18, stop loss $16.11 and target $16.32 marks.


