


 JPMorgan Cuts Gold Price Forecast, Sees Bullion Reaching $4,500 by End of 2026
  AI can be a personal trainer in your pocket – but is it safe?
  USA at 250: the Black American struggle for life, liberty and the pursuit of happiness
  Bernstein Names IAG, Ryanair as Top European Airline Stocks Ahead of Earnings
  Goldman Sachs Raises USD/JPY Forecast, Sees Yen Weakness Persist Through 2027
  Gold Pulls Back After Hitting $4,180 as Geopolitical Risk Sends Crude Higher
  Buy the Dip: Gold Holds Strong at $3980, Targets $4150
  In a rebuke to Trump, the Supreme Court rules that birthright citizenship is the law of the land
  Alcohol is one of the most dangerous drugs, yet its presence is ubiquitous in social settings and celebrations
  Gold Surges Past $4150 on Dovish Fed Signals and Weak Jobs Data; Bullish Outlook Prevails


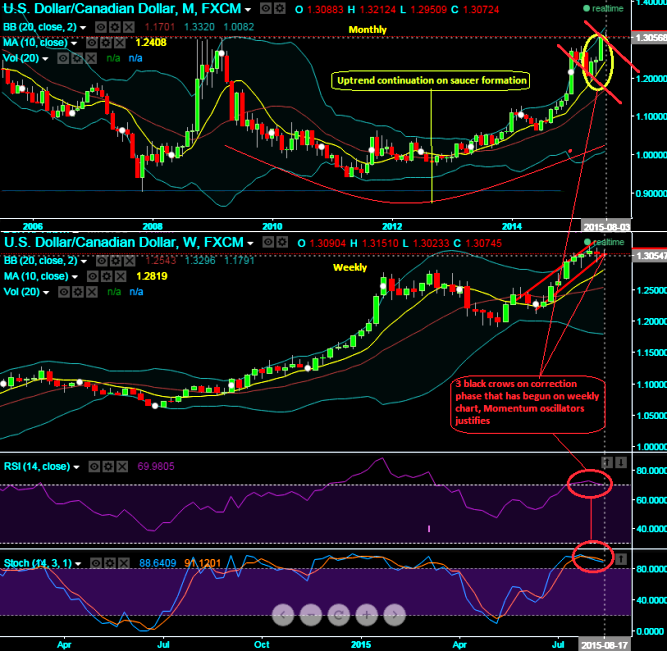
Long term charts evidences the saucer pattern on this pair, a rounding bottom of the prolonged downtrend can used to suggest that the long term trend is reversed. Currently the pair is testing trendline support at 1.3070 levels, if we have to compare the same with monthly plotting then we arrive with 3 black crows in a row which signals short term correction.
Since this pattern has been bullish continuation which we've been observing loony losing and dollar gaining consistently along with crude slumps as well. But for now it is looking to halt and shifting into correction mood.
Generally this pattern will have a powerful move of some 10 to 24 months which we already saw since October 2012, for now the pair is heading towards a market correction mood. The pair will likely sell off into the correction in a downward fashion for maybe 20 to 35% off the old high point. The time factor is generally anywhere from 8 to 12 weeks depending on the overall market condition.
Hence, the overall uptrend in long run remains intact with reasonable corrections on the cards in short to medium term trend.

- News

- Economy

- Central Banks
- Investing
- Research
- Roundups
- Digital Currency
- Insights
- Technical Analysis
- Technology
- Business
- Law
- Health
- Nature
- Fintech
- Science
- Topic
- Opinions
- ©Econometrics LLC . All Rights Reserved.
FxWirePro: Saucer pattern on USD/CAD, retesting trendline support – bull run to resume if 1.3025 sustains
Wednesday, August 19, 2015 12:56 PM UTC
Editor's Picks


- Market Data
Most Popular


