


 FxWirePro: Daily Commodity Tracker - 21st March, 2022


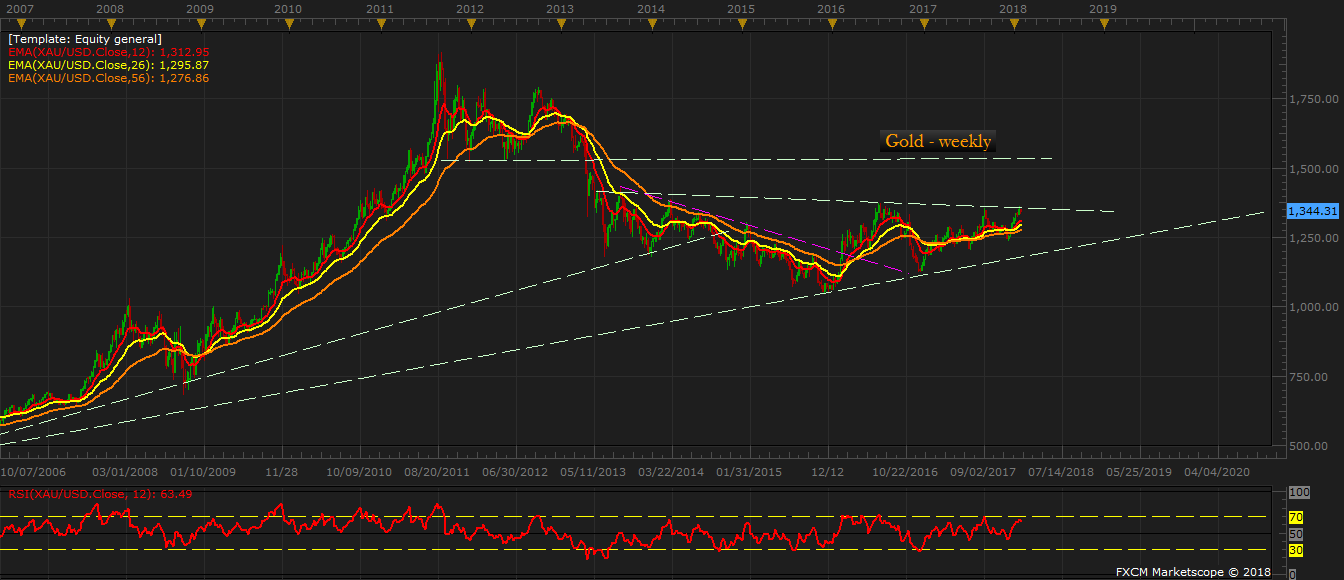
The gold has benefited immensely from a weaker dollar in 2018, ongoing geopolitical uncertainties and a rising inflation. After bottoming around $1230 per troy ounce in last December, it has sharply moved higher and is currently trading at $1345 per troy ounce.
The chart shows that the yellow metal is currently testing a key resistance line around $1350 per troy ounce area, which has halted gold’s advance four times since 2013. However, it is also important to recognize that gold has broken a key downtrend line (marked in pink) in early 2016 that has also resisted gold’s advance five times since 2013.
While we are closely watching the price action, one of our forecasting models, which has a successful track record over medium to long term is signaling that the yellow metal could rise to as high as $1520 area.
Trade idea:
Since gold is currently at resistance, we would prefer to buy at dips of every $20 per troy ounce with a target of $1520. We would recommend the stop loss in a subsequent article when price action becomes clearer.


