


 FxWirePro- Major Pair levels and bias summary
  FxWirePro- Major Crypto levels and bias summary
  FxWirePro: USD/CNY hovers near 3-1/2-year low ahead of U.S. data
  GBPJPY Consolidates Above 215 on Bullish Momentum: Buy Dips Toward 217
  FxWirePro:' USD/CAD faces downside risk below 1.4000
  FxWirePro: USD/CAD hits two-month low as oil prices rise
  GBPJPY Surges on Yen Weakness – Bullish Dip Buy Eyes 217
  FxWirePro: GBP/USD gains above 1.3500 ahead of key U.S. and UK data
  FxWirePro- Woodies pivot (Major)
  EURUSD Flat Amid Middle East Tension – Bullish Dip Buy Eyes 1.1660
  AUDJPY Rebounds on Yen Weakness – Bullish Buy Setup Above 112 Targets 115
  EURGBP Weakens After Doji – Bearish Bias Intact Below 0.8600, Sell Rallies
  Currency Score Major Pair: Extremely Bullish GBPUSD, AUDUSD & NZDUSD – Key Levels to Watch
  JPY Currency Scoreboard: USDJPY and NZDJPY Emerge as Top Bullish Pairs to Watch
  FxWirePro- Major Pair levels and bias summary
  FxWirePro: GBP/USD trades sideways as markets await U.S. inflation and UK GDP data


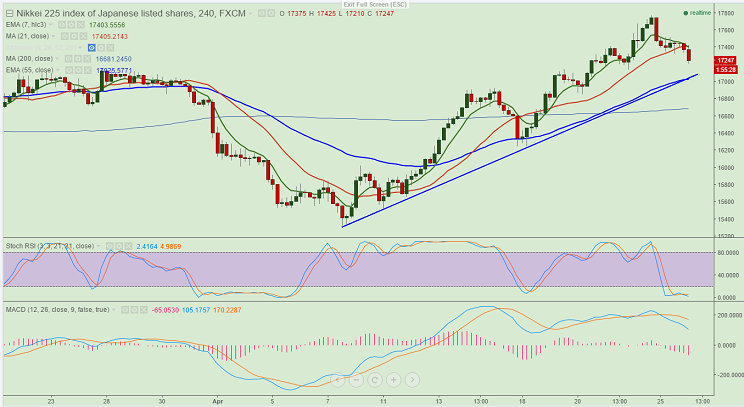
- Major resistance - 18150 (200 day MA)
- The index has retreated after making a high of 1770. It is currently trading around 17240.Short term trend is slightly bearish as long as resistance 18150 holds.
- The index major resistance is around 18150 and any break above will take the index to next level 18300/18500.The minor resistance is around 17898 (Feb 1st 2016 high).
- On the lower side major support is around 17200 and break below will drag the index down till 16900/16650 (200 day 4 HMA) in short term. The minor support is around 17500 (7 day 4 EMA).
- Short term weakness can be seen only below 15000.
It is good to sell on rallies around 17500 with SL around 17800 for the TP of 17400/17200/16900.







