


 FxWirePro: AUD/USD dips below lower range, bearish bias increases
  JPY Pairs Action Bias: EURJPY Leads as Bullish Standout Amid Mixed Momentum
  EURUSD Spikes to 1.14306 on Fed Pause as Traders Eye Sell-the-Rally Setup
  FxWirePro- Woodies pivot (Major)
  FxWirePro: GBP/AUD gains some upside momentum but still bearish
  FxWirePro: USD/JPY eases ahead of Fed decision , Intervention risks linger
  FxWirePro: USD/ CNY remains soft ahead of Fed decision
  FxWirePro: GBP/USD edges lower ahead of Fed policy verdict
  FxWirePro: USD/ZAR firms ahead of Fed interest rate decision
  FxWirePro:EUR/NZD gains some upside momentum but still bearish
  FxWirePro: GBP/NZD maintains bersish bias with focus on 2.2900 level
  FxWirePro: GBP/AUD gains above 1.9200 level , upside pressure builds
  NZDJPY Bullish Rebound: Buy Dips as EMAs Align for 97 Target
  FxWirePro : GBP/NZD strongly bearish despite upside attempts
  Buy the Dips on EUR/JPY: Bullish Structure Points to 188 Target Ahead of Fed
  FxWirePro: NZD/USD neutral in the near-term, scope for downward resumption


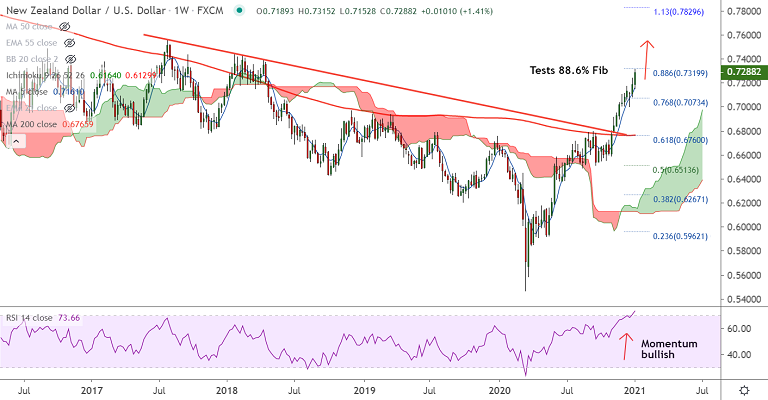
NZD/USD chart - Trading View
Technical Analysis:
Moving Averages: All major MAs are biased higher
Bollinger Bands: Wide and expanding
Oscillators: Stochs and RSI are at overbought levels, but no signs of retrace
MACD: Bullish MACD crossover on signal line, bias higher
ADX: Positive DMI dominance, ADX at 40 and rising
GMMA Indicator: Long and short term MAs are rising, suggests major and minor trend are bullish
NZD/USD trades above 200 month MA for the first time since June 2018. The pair is in a major bull trend and is currently hovering around 88.6% Fib at 0.7320. The pair is all set to challenge the 2018 high of 0.7437.
Focus remains on how the Democrats gain the Senate and any hints of further escalations in the US-China trade tussle as well as Japan’s and UK's covid emergencies. On the data front, markets will be closely watching U.S. ISM Services PMI later today ahead of Non-farm Payrolls due Friday for impetus.


