


 FxWirePro: EUR/ AUD gains some ground , but remains on bearish path
  Buy the Dips on EUR/JPY: Bullish Structure Points to 188 Target Ahead of Fed
  EUR/JPY Holds Bullish Bias as Euro Extends Recovery
  FxWirePro: USD/ZAR firms ahead of Fed interest rate decision
  Major Forex Pairs Action Bias: GBPUSD and AUDUSD Turn Extremely Bearish
  JPY Action Bias: USDJPY Emerges as the Clear Bullish Pair to Watch Amid Mixed Crosses
  NZDJPY Pullback: Sell Rallies Toward 93.30 as Yen Weakness Eases
  FxWirePro : USD/JPY holds relatively bid on 163 ahead Of FOMC,BoJ meetings
  FxWirePro- Woodies pivot (Major)
  EUR/USD Bounces from Monthly Low, But Bearish Pressure Remains
  FxWirePro: AUD/USD falls after softer-than-expected Australian Q2 CPI
  FxWirePro: NZD/USD neutral in the near-term, scope for downward resumption
  FxWirePro: USD/CAD runs out of steam but maintains bullish outlook
  NZD/JPY Flatlines Near 94.60: Will Key Support Reignite the Uptrend?
  AUDJPY Weakness Deepens: Sell Rallies Toward 112 as Aussie Dollar Falters
  FxWirePro: USD/ZAR retreats but trend is still bullish
  FxWirePro: USD/ CNY remains soft ahead of Fed decision


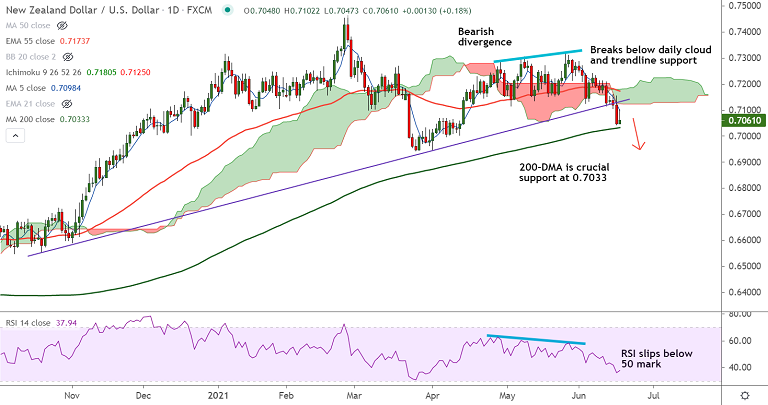
NZD/USD chart - Trading View
Spot Analysis:
NZD/USD was trading 0.21% higher on the day at 0.7062 at around 07:50 GMT.
Previous Session's High/ Low: 0.7154/ 0.7042
Previous Week's High/ Low: 0.7242/ 0.7115
Fundamental Overview:
Data released earlier on Thursday showed New Zealand GDP swept past forecasts at 0.05% and printed at 1.6% in three months through to March.
A housing boom and strong retail spending pushed GDP higher, avoiding a second recession and bringing forward expectations for tighter monetary policy.
Annual GDP rose 2.4% in the first quarter, Statistics New Zealand said, compared with analyst expectations for a 0.9% rise.
Following the upbeat data, Australia and New Zealand Banking Group( ANZ) forecasted that the Reserve Bank of New Zealand (RBNZ) would raise the Official Cash Rate (OCR) as soon as in Feb 2022 than earlier forecasted in Aug 2022.
Technical Analysis:
- NZD/USD has slipped below daily cloud and major trendline support
- Oscillators show bearish bias, Stochs and RSI are sharply lower
- Recovery capped at 5-DMA, pair erases early gains and slips lower from session highs at 0.7102
- Bearish divergence on the daily charts adds to the downside bias
Major Support and Resistance Levels:
Support - 0.7033 (200-DMA), 0.70, 0.6955 (50W MA)
Resistance - 0.7096 (5-DMA), 0.7132 (110-EMA), 0.7165 (21-EMA)
Summary: Upbeat data which brought forward RBNZ rate hike expectations buoyed the kiwi, pushing the pair higher. However, upside likely to be limited as major technical bias is bearish and strong US dollar keeps downside pressure in the pair.
200-DMA is crucial support for the pair. Watch out for break below for major weakness. Next major bear target lies at 50W MA at 0.6955.


