


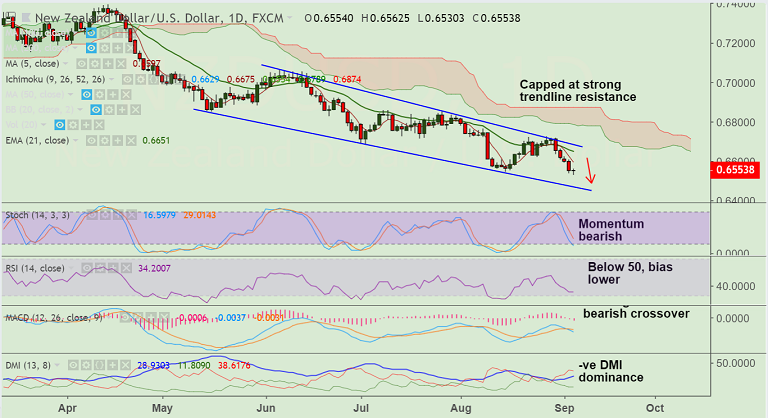
NZD/USD chart on Trading View used for analysis
- NZD/USD hits new 2-1/2 year lows at 0.6530 after disappointing GDT auction.
- New Zealand's bi-weekly GDT auction showed that the GDT price index declined 0.7% following the 3.6% fall witnessed in the previous auction.
- There is now a growing conviction among markets that the next RBNZ policy move will be a cut - rather than a hike.
- Major trend in the pair remain bearish. Kiwi bears firmly in control, NZD/USD targets trendline support at 0.6475.
- However, hourly charts show signs of minor pullbacks. Bullish divergence on RSI and Stochs adds to the bullish bias.
- Breakout at 1H 21-SMA could see test of 1H 55-EMA at 0.6581. 5-DMA offers strong resistance above at 0.6597.
Support levels - 0.6522 (lower BB), 0.6475 (trendline), 0.6428 (Nov 2015 low)
Resistance levels - 0.6558 (1H 21-EMA), 0.6581 (1H 55-EMA), 0.6597 (5-DMA)
Call update: Our previous call (https://www.econotimes.com/FxWirePro-NZD-USD-Trade-Idea-1423280) has hit TP1/2.
Recommendation: Book partial profits at lows. Bias lower, hold for further downside.
FxWirePro Currency Strength Index: FxWirePro's Hourly NZD Spot Index was at -119.82 (Bearish), while Hourly USD Spot Index was at 145.191 (Bullish) at 0445 GMT. For more details on FxWirePro's Currency Strength Index, visit http://www.fxwirepro.com/currencyindex.


