


 FxWirePro: USD/CAD runs out of steam but maintains bullish outlook
  FxWirePro : USD/JPY holds relatively bid on 163 ahead Of FOMC,BoJ meetings
  FxWirePro: GBP/NZD maintains bersish bias with focus on 2.2900 level
  FxWirePro: USD/CAD gaining momentum for a move towards 1.4200 level
  EUR/USD Bounces from Monthly Low, But Bearish Pressure Remains
  FxWirePro- Woodies pivot (Major)
  FxWirePro: USD/ZAR uptrend loses steam, remains on bullish path
  FxWirePro: NZD/USD edges lower, remains on back foot
  EUR/JPY Holds Bullish Bias as Euro Extends Recovery
  FxWirePro: AUD/USD dips after RBA Governor speech
  FxWirePro: EUR/NZD up trend gains momentum but hurdles ahead
  FxWirePro: EUR/AUD outlook weaker on renewed downside pressure
  Crypto Action Bias: ETHUSD Stands Out as the Bullish Pair to Watch
  JPY Action Bias: USDJPY Emerges as the Clear Bullish Pair to Watch Amid Mixed Crosses
  FxWirePro: GBP/AUD gains some upside momentum but still bearish
  FxWirePro- Major Pair levels and bias summary


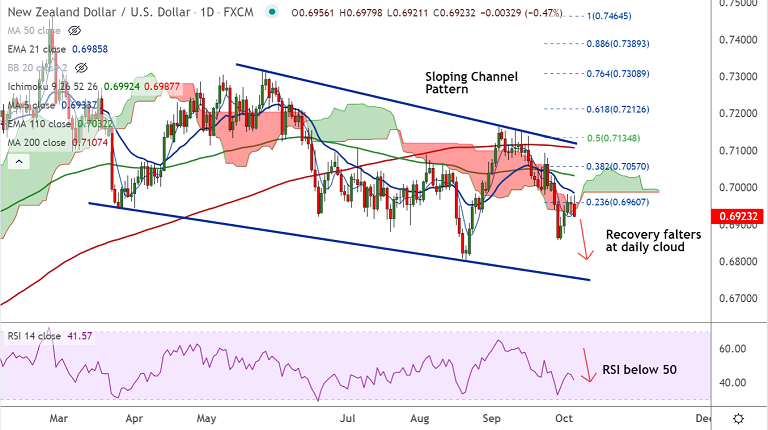
NZD/USD chart - Trading View
Spot Analysis:
NZD/USD was trading 0.48% lower on the day at 0.6922 at around 04:40 GMT
Previous Week's High/ Low: 0.7033/ 0.6859
Previous Session's High/ Low: 0.6976/ 0.6927
Fundamental Overview:
New Zealand's central bank hiked interest rates at its policy meeting early on Wednesday for the first time in seven years and signalled further tightening to come.
The Reserve Bank of New Zealand (RBNZ) increased the cash rate to 0.50% as had been forecasted by economists.
The 25 basis point rate hike marks the start of a tightening cycle as the central bank looks to get on top of inflationary pressures and cool a red-hot housing market.
Future moves depending on the medium-term outlook for inflation and employment. The central bank expects headline CPI inflation to increase above 4% in the near-term but return towards its 2% midpoint over the medium term.
Economists expect the benchmark rate to reach 1.50% by the end of next year and 1.75% by the end of 2023.
Technical Analysis:
- NZD/USD resumes downside in sloping channel pattern
- Recovery attempts were rejected at daily cloud
- Momentum is bearish, RSI is well below the 50 mark
- GMMA indicator shows major and minor trend are bearish on the daily charts
Major Support and Resistance Levels:
Support - 0.6870 (trendline), Resistance - 0.6985 (21-EMA)
Summary: NZD/USD failure at 21-EMA reinforces downside in the pair. Test of 0.6870 likely ahead of 0.6805 (2021 low till date).


