


 FxWirePro:EUR/NZD gains some upside momentum but still bearish
  AUD/JPY Slips Below 112 as BOJ Intervention Sparks Bearish Momentum: Sell the Rallies
  NZDJPY Bullish Rebound: Buy Dips as EMAs Align for 97 Target
  FxWirePro: GBP/NZD remains weak, eyes 38.2%fib support
  FxWirePro: GBP/USD edges lower ahead of Fed policy verdict
  FxWirePro- Major Pair levels and bias summary
  FxWirePro: USD/CAD slips after Fed holds rates steady
  FxWirePro- Major Crypto levels and bias summary
  Nikkei Surges Past 65,000 on Suspected Yen Weakness: Tech Giants Like Advantest and NEC Lead Explosive Gains
  FxWirePro: NZD/USD firms as Kiwi gains on strong ANZ business outlook data
  FxWirePro : GBP/NZD strongly bearish despite upside attempts
  FxWirePro- Major Pair levels and bias summary
  EURUSD Spikes to 1.14306 on Fed Pause as Traders Eye Sell-the-Rally Setup
  Major FX Action Bias & US Market Sentiment: NZD/USD (Extremely Bullish) & AUD/USD (Bullish) Watchlist
  FxWirePro: GBP/AUD drifts lower after BOE rate decision


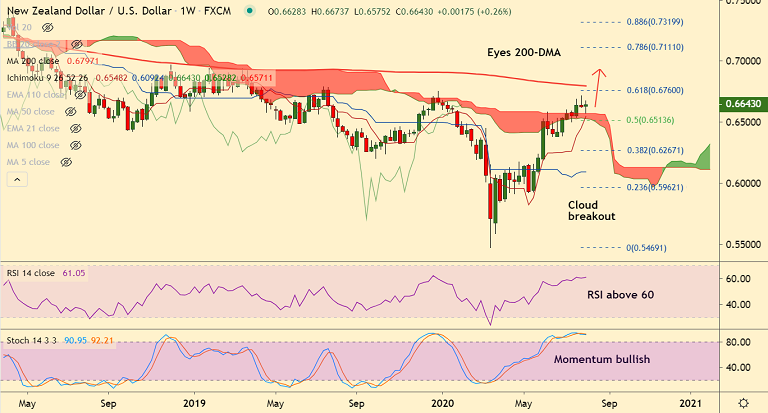
NZD/USD chart - Trading View
Technical Analysis: Bias Bullish
GMMA Indicator
- Major trend is bullish, minor trend is neutral on the daily charts
- On the weekly charts, minor trend is strongly bullish, major trend is seeing a bullish shift
Ichimoku Analysis
- Price action is above cloud on the daily and weekly charts
- Chikou span shows some sideways movement on the daily charts
Oscillators
- Stochs and RSI have rolled over from overbought levels
- Oscillators hold bullish momentum
Bollinger Bands
- Bollinger bands are wide. Volatility remains high on the daily and weekly charts
Fundamentals: The antipodeans buoyed by rising market optimism. US dollar weakness across the board also supports gains. Further the latest Reserve Bank of New Zealand (RBNZ) survey shows New Zealand's (NZ) one and two-year inflation expectations picked-up in Q3 2020.
Major Support Levels: 0.6607 (21-EMA), 0.6571 (Weekly cloud top)
Major Resistance Levels: 0.6760 (61.8% Fib), 0.6797 (200W MA)
Summary: NZD/USD struggling to extend gains after 'Inverted Hammer' formation on the previous weeks' candle. Technical bias remains bullish, scope for upside resumption. Next major hurdle aligns at 61.8% Fib at 0.6760 ahead of 200W MA at 0.6797.


