


 FxWirePro- Major Crypto levels and bias summary
  NZDJPY Retreats on Yen Strength – Bearish Setup Targets 90 After Hitting 92.75 Low
  FxWirePro: GBP/USD rises as soft US data pressures dollar
  JPY Currency Meter Signals: NZDJPY Bullish (+25) vs CHFJPY (-100) – These Pairs Could Move Next
  US Magnificent 7 Stocks Trend Score: Amazon & Microsoft Hit Extreme Bullish (+100) as Meta Drops to -100 — Key Resistance & Support Watchlist
  Major European Indices Score Extremely Bullish: DAX Eyes 26000, CAC Targets 8600, FTSE100 at 11000 – Key Levels to Watch
  FxWirePro: GBP/AUD drifts lower after BOE rate decision
  Major FX Action Bias & US Market Sentiment: NZD/USD (Extremely Bullish) & AUD/USD (Bullish) Watchlist
  FxWirePro: AUD/USD gains some ground but outlook is bearish
  FxWirePro- Major Pair levels and bias summary
  FxWirePro: GBP/AUD bears maintain upper hand
  FxWirePro: USD/ZAR gains as stronger dollar outweighs upbeat South Africa's trade surplus
  FxWirePro: USD/CAD retreats after Canada posts stronger-than-expected GDP growth
  FxWirePro: USD/CNY dips to hit three year low,scope for further downside
  US Magnificent 7 Stocks Trend Score: Amazon & Microsoft Hit Extreme Bullish (+100) as Meta Drops to -100 — Key Resistance & Support Watchlist
  FxWirePro- Major Pair levels and bias summary


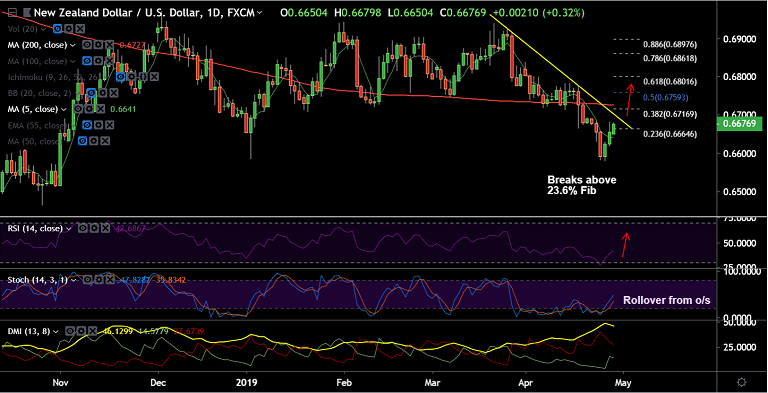
NZD/USD chart - Trading View
Fundamental Views:
- Greenback fails to capitalise on upbeat U.S. GDP data
- Markets now await FOMC decision, markets anticipate more dovishness from policymakers.
- Antipodeans buoyed as China’s industrial profits surged after the previous two months of deterioration.
Technical Analysis:
- Price action is extending gains above 5-DMA
- The pair is consolidating break above 1H 200 SMA
- Stochs and RSI are showing a roll over from oversold levels
- Major trend is bearish, stiff resistance seen at 0.6713 (converged 20-DMA and 21-EMA)
- Decisive breakout at 200-DMA will see further upside, break below 5-DMA could see resumption of weakness
Data Watch:
- US personal spending details (Monday 1230 GMT)
Support levels - 0.6666 (1H 200-SMA), 0.6642 (5-DMA), 0.66
Resistance levels - 0.67 (trendline), 0.6713 (converged 20-DMA and 21-EMA), 0.6727 (200-DMA)
For details on FxWirePro's Currency Strength Index, visit http://www.fxwirepro.com/currencyindex.

- News

- Economy

- Central Banks
- Investing
- Research
- Roundups
- Digital Currency
- Insights
- Technical Analysis
- Technology
- Business
- Law
- Health
- Nature
- Fintech
- Science
- Topic
- Opinions
- ©Econometrics LLC . All Rights Reserved.
FxWirePro: NZD/USD consolidates break above 1H 200 SMA, intraday bias higher
Monday, April 29, 2019 4:24 AM UTC
Editor's Picks


- Market Data
Most Popular


