


 FxWirePro: USD/CNY dips to hit three year low,scope for further downside
  Major European Indices Score Extremely Bullish: DAX Eyes 26000, CAC Targets 8600, FTSE100 at 11000 – Key Levels to Watch
  FxWirePro: EUR/ AUD dips below 1.6400 level, focus on near term support
  Nikkei Surges Past 65,000 on Suspected Yen Weakness: Tech Giants Like Advantest and NEC Lead Explosive Gains
  All Major JPY Pairs Hit Extreme Bearish Score of -100: USDJPY, EURJPY, GBPJPY, AUDJPY, NZDJPY & CADJPY Flash Maximum Weakness
  FxWirePro- Major Pair levels and bias summary
  FxWirePro: USD/CAD retreats after Canada posts stronger-than-expected GDP growth
  FxWirePro: AUD/USD cedes early gains ,outlook bearish
  FxWirePro- Major Crypto levels and bias summary
  FxWirePro: USD/CNY downtrend loses steam, remains on bearish path
  FxWirePro: USD/ZAR gains as stronger dollar outweighs upbeat South Africa's trade surplus
  US Magnificent 7 Stocks Trend Score: Amazon & Microsoft Hit Extreme Bullish (+100) as Meta Drops to -100 — Key Resistance & Support Watchlist
  NZDJPY Bears Stay in Command: Sell Rallies at 92.72-75 Targeting 90 as All EMAs Flash Red
  FxWirePro: GBP/NZD remains weak, eyes 38.2%fib support
  FxWirePro: AUD/USD gains some ground but outlook is bearish
  FxWirePro- Major Crypto levels and bias summary


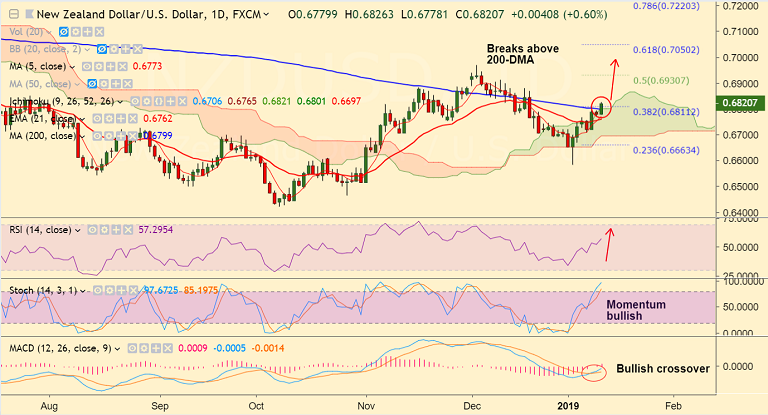
NZD/USD chart on Trading View used for analysis
- NZD/USD has shown a break above 200-DMA, further upside likely on bullish momentum.
- Momentum studies are bullish. Stochs and RSI are biased higher. RSI shows strength above 50 levels with scope to rise further.
- MACD is showing a bullish crossover on signal line which adds to the bullish bias.
- Break above 200-DMA raises scope for test of 50% Fib at 0.6930 ahead of 0.6969 (Dec 4th high).
- On the flipside, retrace below 200-DMA will see dip till 5-DMA at 0.6773. Further weakness on break below.
- Focus on US inflation data due later today for further impetus. Analysts expect headline and core CPI to be unchanged.
- Stable inflation is likely to support new Fed rate caution, lowering the odds for a first half rate hike, weighing on the dollar and adding upside support to the major.
Support levels - 0.68 (200-DMA), 0.6773 (5-DMA), 0.6763 (21-EMA), 0.6663 (23.6% Fib)
Resistance levels - 0.6858 (Upper BB), 0.69, 0.6930 (50% Fib)
Recommendation: Stay long on close above 200-DMA, SL: 0.6770, TP: 0.6860/ 0.69/ 0.6930
For details on FxWirePro's Currency Strength Index, visit http://www.fxwirepro.com/currencyindex.


