


 FxWirePro- Woodies Pivot(Major)
  FxWirePro: EUR/NZD remains under pressure as key support gives way
  Bitcoin’s Islamabad Watch: BTCUSD Consolidates Near 71,421 USD as Geopolitical Peace Talks Loom
  FxWirePro: AUD/USD spikes as Trump announces two-week Iran ceasefire
  Ethereum’s Healthy Correction: Bulls Eye Strategic Re-Entry at 2,150 USD Following Profit-Booking Pullback
  FxWirePro: USD/ZAR slips sharply lower as US-Iran ceasefire lifts risk appetite
  Ethereum Reclaims Higher Ground: Ether Bulls Target $2,700 as Middle East Tensions Thaw
  FxWirePro: GBP/AUD takes back some lost ground
  Pound on Pause: GBPJPY Bulls Regroup for a Potential Sprint Toward 215.00
  FxWirePro -Major European Indices
  Aussie Bulls Charge: AUD/JPY Rallies as Geopolitical Clouds Part
  FxWirePro: USD/JPY steadies around 158.75, bias bullish
  FxWirePro: USD/CNY falls to three-year high, scope for further downside
  Aussie Consolidates After Peak: AUDJPY Bulls Eye a Strategic Entry for the 115.00 Target
  FxWirePro:NZD/USD jumps as RBNZ warns of higher OCR potential
  FxWirePro: EUR/ NZD downside pressure builds, key support level in focus
  FxWirePro- Major Pair levels and bias summary


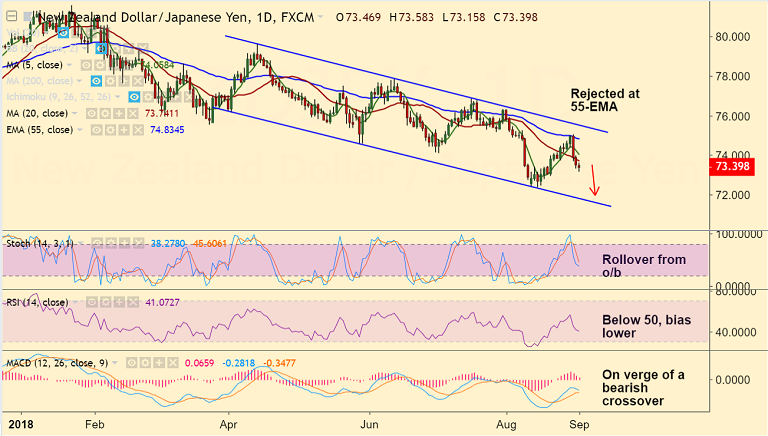
NZD/JPY chart on Trading View used for analysis
- NZD/JPY has resumed weakness after the pair was rejected at 55-EMA resistance in last week's trade.
- Price action has slipped below 21-EMA and technicals support further weakness.
- Stochs have rolled over from overbought levels and RSI has slipped below 50 levels.
- MACD is on verge of bearish crossover on signal line which if complete will add to the bearish bias.
- The pair is trading in a sloping channel pattern and we see scope for test of channel base at 71.75.
- Bearish invalidation only above 55-EMA at 74.83.
Support levels - 73, 72.35 (Aug 13 low), 71.75 (channel base)
Resistance levels - 73.74 (20-DMA), 74.07 (5-DMA), 74.83 (55-EMA)
Recommendation: Good to stay short on upticks, SL: 74.10, TP: 73/ 72.35/ 72/ 71.75
FxWirePro Currency Strength Index: FxWirePro's Hourly NZD Spot Index was at -68.7995 (Neutral), while Hourly JPY Spot Index was at 30.1211 (Neutral) at 0815 GMT. For more details on FxWirePro's Currency Strength Index, visit http://www.fxwirepro.com/currencyindex.


