


 FxWirePro: GBP/NZD remains weak, eyes 38.2%fib support
  FxWirePro: USD/CNY dips to hit three year low,scope for further downside
  FxWirePro: GBP/USD rises as soft US data pressures dollar
  Nikkei Surges Past 65,000 on Suspected Yen Weakness: Tech Giants Like Advantest and NEC Lead Explosive Gains
  FxWirePro: GBP/NZD remains weak, eyes 38.2%fib support
  Major European Indices Score Extremely Bullish: DAX Eyes 26000, CAC Targets 8600, FTSE100 at 11000 – Key Levels to Watch
  Major FX Action Bias & US Market Sentiment: NZD/USD (Extremely Bullish) & AUD/USD (Bullish) Watchlist
  FxWirePro- Major Crypto levels and bias summary
  NZDJPY Retreats on Yen Strength – Bearish Setup Targets 90 After Hitting 92.75 Low
  FxWirePro- Major Crypto levels and bias summary
  US Magnificent 7 Stocks Trend Score: Amazon & Microsoft Hit Extreme Bullish (+100) as Meta Drops to -100 — Key Resistance & Support Watchlist
  US Magnificent 7 Stocks Trend Score: Amazon & Microsoft Hit Extreme Bullish (+100) as Meta Drops to -100 — Key Resistance & Support Watchlist
  FxWirePro- Woodies pivot (Major)
  FxWirePro: USD/ZAR gains as stronger dollar outweighs upbeat South Africa's trade surplus
  FxWirePro- Major Pair levels and bias summary


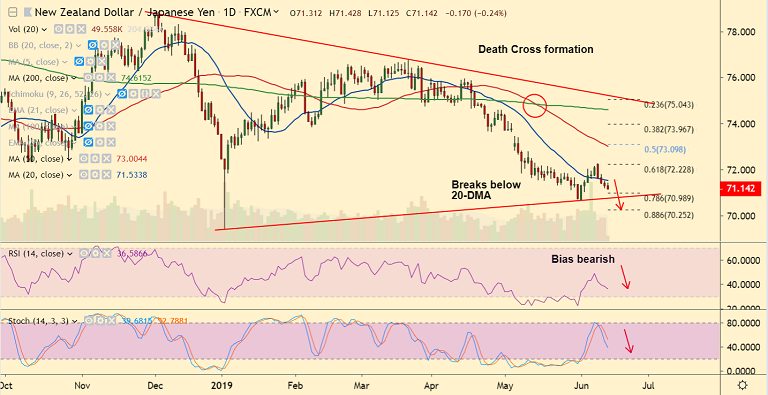
NZD/JPY chart - Trading View
NZD/JPY is extending declines for the 4th straight session, trades 0.24% lower at 71.14 at 03:00 GMT.
'Death Cross' (bearish 50-DMA crossover on 200-DMA) formation on the daily charts keeps bias lower.
The pair has failed to hold break above 20-DMA, retraces below and is on track to test 78.6% Fib at 70.98.
Technical indicators have turned bearish. Stochs and RSI are sharply lower and Stochastics RSI is showing a rollover from overbought levels.
We see scope for weakness till 69.41. Break above 21-EMA will see gains till 110-EMA. Bearish invalidation only above 200-DMA (74.61).
Support levels - 70.98 (78.6% Fib), 70.70 (trendline), 70.25 (88.6% Fib)
Resistance levels - 71.53 (converged 5 and 20 DMAs), 71.75 (21-EMA), 72.84 (55-EMA)
Recommendation: Good to go short on upticks, SL: 71.80, TP: 70.95/ 70.25/ 69.40
For details on FxWirePro's Currency Strength Index, visit http://www.fxwirepro.com/currencyindex.


