


 US Futures Rise as Investors Eye Earnings, Inflation Data, and Wildfire Impacts
  Bitcoin Sheds $491M in ETF Outflows and Retreats Below $64K; Sellers Reload for $50K
  FxWirePro: AUD/USD eases after Australian mixed CPI data
  Sterling Slump Sends GBPJPY Toward 212.60 — Bearish EMA Stack Eyes 210
  Geopolitical Shocks That Could Reshape Financial Markets in 2025
  FxWirePro: EUR/AUD bullish outlook with scope to target 1.6500
  EURJPY Bounce Loses Steam Below 184 — Sell-the-Rally Setup Eyes 183 Target
  Trump’s "Shock and Awe" Agenda: Executive Orders from Day One
  FxWirePro- Major Pair levels and bias summary
  FxWirePro: EUR/AUD bullish outlook with scope to target 1.6550
  US Gas Market Poised for Supercycle: Bernstein Analysts
  Goldman Predicts 50% Odds of 10% U.S. Tariff on Copper by Q1 Close
  Wall Street Analysts Weigh in on Latest NFP Data
  Energy Sector Outlook 2025: AI's Role and Market Dynamics
  Stock Futures Dip as Investors Await Key Payrolls Data
  FxWirePro: USD/ZAR remains buoyant, looks to extend gains
  Urban studies: Doing research when every city is different


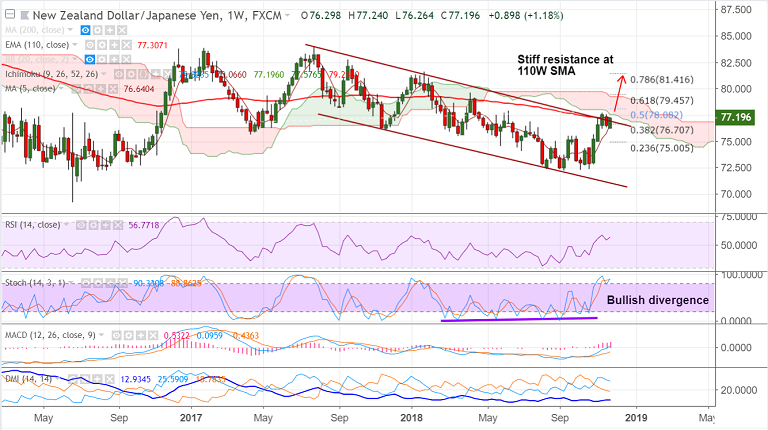
NZD/JPY chart on Trading View used for analysis
- NZD/JPY is attempting breakout of sloping channel pattern.
- The pair has been extending choppy trade at 110-W EMA resistance.
- We are seeing a grind along channel top and breakout there could see bullish continuation.
- A bullish divergence on Stochs on the weekly charts adds to upside scope.
- Breakout at 110-W EMA finds next major resistance at weekly cloud at 77.57.
- On the flipside, 76.64 (5W SMA is immediate support), weakness likely on break below.
Support levels - 76.63 (5W SMA), 75 (23.6% Fib)
Resistance levels - 77.30 (110-W EMA), 77.57 (weekly cloud base), 79.45 (61.8% Fib)
For details on FxWirePro's Currency Strength Index, visit http://www.fxwirepro.com/currencyindex.


