


 FxWirePro:GBP/USD recovers slightly from early decline but bears are not done yet
  FxWirePro- Woodies pivot (Major)
  FxWirePro : AUD/USD drifts lower, could be on verge of bigger drop
  FxWirePro- Major Pair levels and bias summary
  FxWirePro: USD/ZAR slips as dollar weakens after PCE inflation data
  GBPJPY Caught in a Tight Range: Bearish EMAs Suggest a Breakout Awaits
  FxWirePro- Major Crypto levels and bias summary
  FxWirePro: NZD/USD extends losing run, eyes 0.5600 level
  Bitcoin Sheds $491M in ETF Outflows and Retreats Below $64K; Sellers Reload for $50K
  AUDJPY Under Pressure: US Dollar Strength and Bearish Technicals Signal Further Declines
  FxWirePro: EUR/ NZD gaining momentum for a move towards 2.0350 level
  FxWirePro: GBP/USD neutral in the near-term, scope for downward resumption
  ETH Bounces as Shorts Cover, Yet ETF Bleed Warns $1,850 Resistance Won’t Break
  FxWirePro- Major Pair levels and bias summary
  FxWirePro: USD/ZAR retreats slightly but trend is still bullish


 bouncing ahead of Kiwi trade balance - hedging rationale for both exporters & importers - EconoTimes)


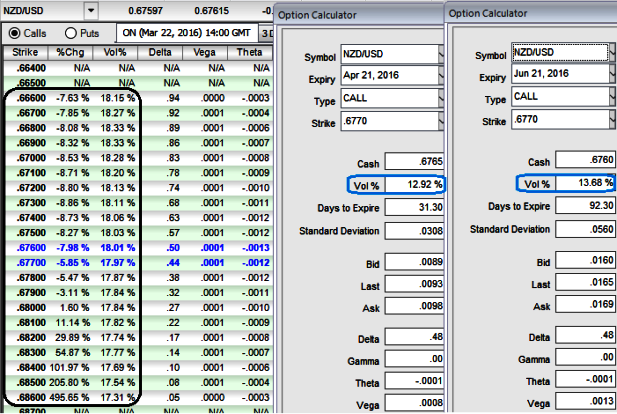
Please be informed that the implied volatilities of ATM contracts of 1-3 months tenors are bouncing about 13-14% ahead of this week's data releases of trade balance from NZ side and goods orders, unemployment claims and GDP (q/q) from U.S. side.
If IV is high, it means the market thinks the price has potential for large movement in either direction. Low IV implies the market thinks the price will not move much.
USD effects are dominating the kiwi as NZD/USD trades above where it was before the RBNZ cut rates. We continue to view the risks to the NZD outlook as being to the downside, but do not see an imminent catalyst, particularly with local data still robust.
This leaves us favouring selling NZD/USD at the top of the range, but without any urgency. We do, however, expect the USD to revert from last week’s FOMC induced sell-off as the data continues to validate a gradual US rate normalisation path. That might well set off the next raft of unease as tensions between the real economy and financial markets flare.
New Zealand trade surplus decreased to NZD 8 million in January of 2016 compared to a NZD 52 million surplus on a YoY basis, as exports rose 5.9%, led by higher sales of milk powder, butter, cheese and cherries, while imports went up at a faster 7.2% mainly due to purchases of intermediate and consumption goods.
Exports from New Zealand increased by 5.9% YoY to NZD 3.9 billion in January of 2016. Exports of milk powder, butter, and cheese, as well as cherries, propelled China further ahead of Australia as New Zealand’s top export destination in January 2016. The value and quantity of cherry exports rose to new record highs.
Exporters’ Strategy: The NZD is at the top of the range (range: 0.6870-0.6510), with a risk positive rally that continues to confound. As such we favour holding off hedging for now, waiting for better levels.
Importers’ Strategy: Importers should consider hedging at current levels. We are near range edges and the TWI remains strong and disconnected with other markets.
Options preferred so as to maintain exposure to lower floating interest rates. You can trade the higher IV value by monitoring an IV chart for NZDUSD underlying market for a certain time period and determine the IV range. The peaks suggest the option is expensive to buy and the troughs suggest the option is inexpensive.


