


 FxWirePro- Major Crypto levels and bias summary
  FxWirePro- Major Crypto levels and bias summary
  ETH Stands Alone Bullish; BTC, SOL, XRP, BNB Neutral


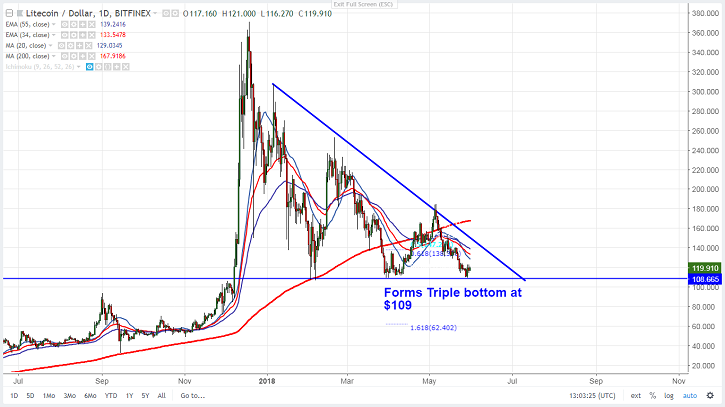
Chart Pattern formed- Triple Bottom
- LTC/USD hits low of $109 and has shown a minor recovery till $123 from that level. It has halted its weakness for a while after continuous selling for four consecutive week. The pair has declined almost 70% from the high of $370. The pair has formed triple bottom around $109 and any break below confirms further weakness. It is currently trading around $112.25. The slight jump in this pair has been using as selling opportunity by traders.
- The near term solid resistance is around $131.78 (3- W EMA) and any break above will take the pair to next level till $140/$150 (20- W MA).
- On the lower side, any break below $109 confirms minor weakness and a decline till $84/$70 is possible.
It is good to buy on dips around $117-$120 with SL around 108 for the TP of $150.


