


 FxWirePro- Major Crypto levels and bias summary
  FxWirePro- Major Crypto levels and bias summary
  Bitcoin Consolidates Near $78K: Will Strong ETF Inflows Trigger a Breakout to $90K?


 Add as a preferred source on Google
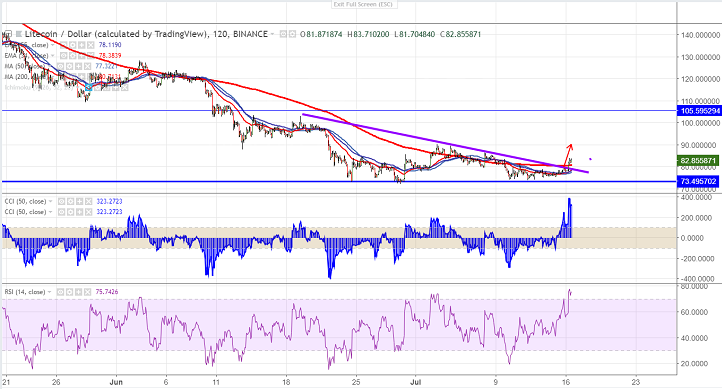
- LTC/USD has formed a double bottom around $73 and shown a good jump of around 15% from that level.The pair has broken minor trend line resistance at $79 and jumped till $83.75. The pair has previously jumped till $90.45 from the low of $72 and started to decline. The pair declined more than 50% from the temporary top $182.35. It is currently trading around $83.45. It has declined almost 79% from the all-time high of $370.
- The near term solid resistance is around $90.25 (Jul 3rd 2018 high) and any break above will take the pair to next level till $103.
- On the lower side, any break below $80 (200- 2H MA) confirms minor weakness and a decline till $73/$70 is possible.
It is good to buy on dips around $78-$80 with SL around $72 for the TP of $90/$102.







